F1 Race Winner Betting: The Full-Field Market and Where the Edges Hide
 Available in US
The 2024 season produced twelve different race winners from four teams – a level of competitive variety that hadn’t existed for years. My race-winner hit rate that season was 11%, which doesn’t sound spectacular until you consider that the average odds on my winners were 7/1. A ten-pound stake plan across 24 races, backing one selection per round, would have yielded a meaningful profit even with 89% of bets losing. That’s the paradox of race-winner betting in F1: you lose most of the time, but the odds compensate when you get it right.
Race winner is the flagship F1 betting market – the one with the deepest liquidity, the widest availability, and the most attention from bookmakers’ trading teams. Every UKGC-licensed operator offers race-winner odds for every Grand Prix, and the market typically opens mid-week before the race with prices based on pre-weekend assessments of car performance, driver form, and circuit characteristics. F1 represents just 0.4% of the global betting handle, which means even this headline market is less efficiently priced than the equivalent market in football or tennis.

How Race Winner Odds Are Compiled and Where the Market Moves
Bookmakers compile race-winner odds using a blend of statistical modelling, historical data, and market positioning. The baseline is each team’s pace relative to the field, assessed from recent race results and adjusted for the upcoming circuit’s characteristics. Each car generates roughly 700 data points per second during a race, and while bookmakers don’t have access to all of that telemetry, they use publicly available timing data, sector splits, and tyre degradation information from practice sessions to refine their models.
The initial odds – published on Tuesday or Wednesday – represent the bookmaker’s best estimate before any weekend data is available. These prices move through four distinct phases. Phase one is the pre-weekend drift: casual punters back their favourite drivers, moving the market in predictable directions. Phase two is the Friday adjustment: FP1 and FP2 data reveals the true competitive order, and bookmakers sharpen their prices accordingly. Phase three is the post-qualifying shift: grid positions are locked in, and the odds contract heavily on the pole-sitter and front-row starters. Phase four is race-morning fine-tuning: weather forecasts, confirmed tyre allocations, and any overnight car changes produce final adjustments.
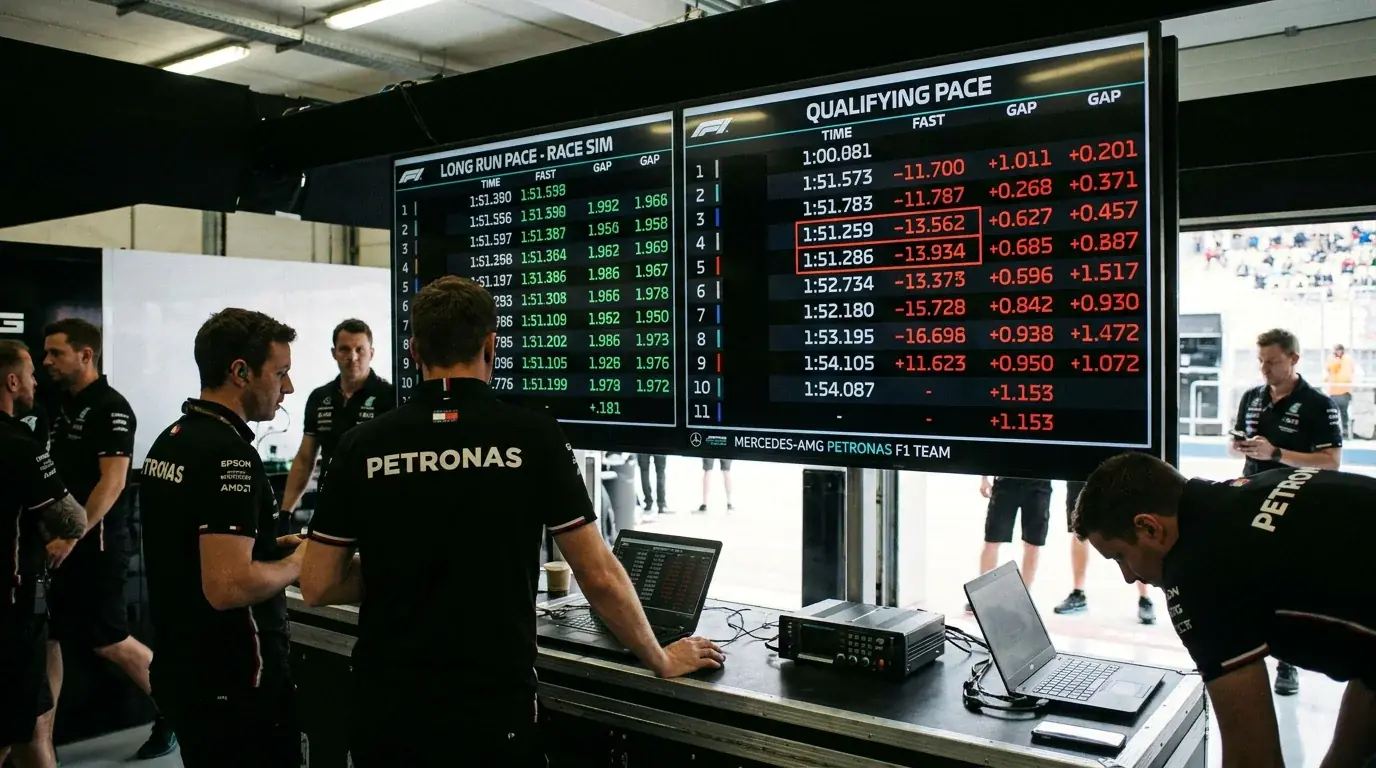
The edges hide in the transitions between phases. The Tuesday opening price is set with the least information and the widest margins. The Friday price incorporates practice data but may lag behind because the trading team is processing dozens of markets simultaneously. The post-qualifying price is the most information-efficient but also the most compressed in terms of value. I find that the Thursday-to-Friday window – after opening prices are set but before practice data is fully absorbed – is where the most consistent value exists, especially on drivers whose circuit-specific form diverges from their season-average form.
From Grid Position to the Chequered Flag: Conversion Rates
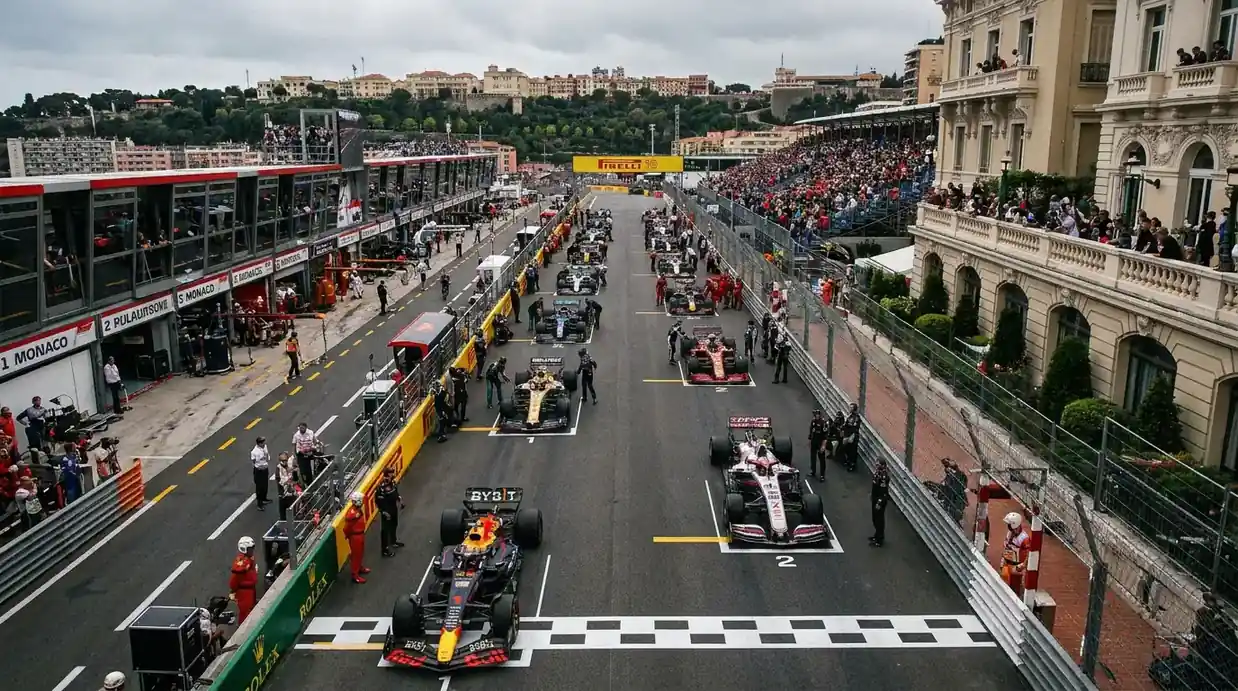
Qualifying position is the single strongest predictor of race outcome, and understanding the conversion rates at each grid slot is fundamental to race-winner betting. Across the past five seasons, the pole-sitter has won roughly 40-45% of races. The driver starting second wins approximately 20%. Starting third converts at about 12%. By the time you reach fifth on the grid, the win conversion rate drops below 7%.

Those numbers should anchor your probability assessments, but they require circuit-specific adjustment. At circuits where overtaking is extremely difficult – Monaco, Hungary, Singapore – the pole-to-win conversion rate is significantly higher, sometimes exceeding 70%. At power circuits with long straights and clear overtaking opportunities – Monza, Spa, Baku – the conversion rate is lower because grid position matters less relative to straight-line speed and tyre strategy.

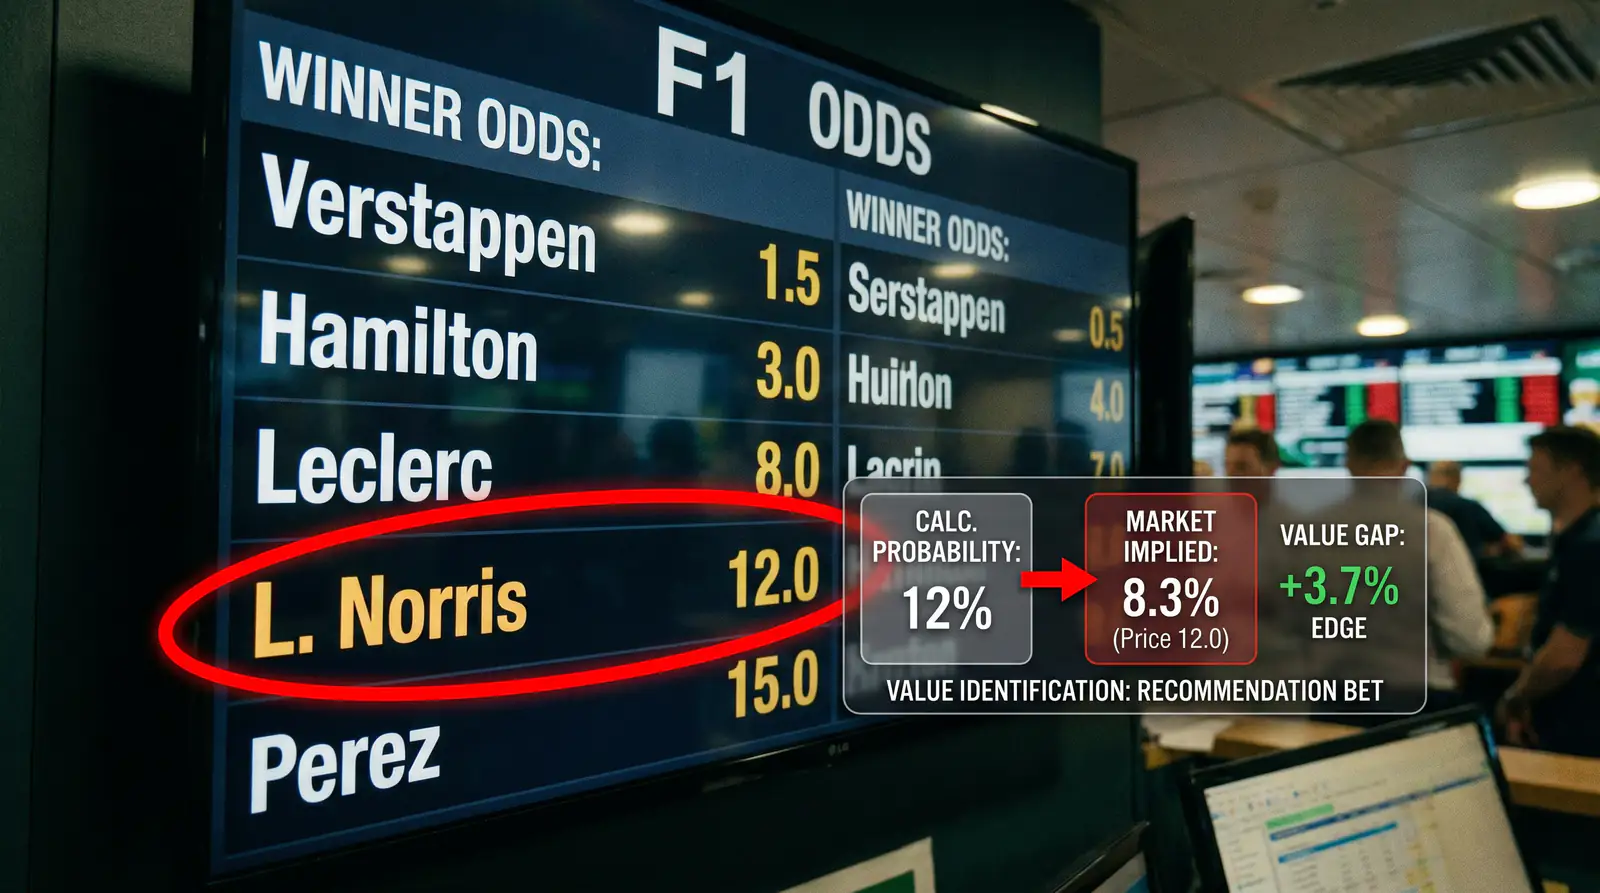
I maintain a circuit-specific conversion table that I update annually. Before each race, I check the conversion rates at the upcoming circuit and compare them against the bookmaker’s implied probabilities. If the pole-sitter’s odds imply a 35% win probability at a circuit where the historical conversion rate is 55%, the market is underpricing the pole advantage. Conversely, if the pole-sitter is priced at an implied 55% at a circuit where the conversion rate is 35%, the market is overpricing grid position. These discrepancies are the foundation of my race-winner selection process.
Finding Value Beyond the Top Three on the Starting Grid
Twenty-eight percent of F1 fans have placed a sports bet in the past year – the highest propensity in any major sport – but most of those bets are concentrated on the pre-race favourites. The volume on drivers starting fourth or lower is comparatively thin, which means the odds on midfield selections are set with less market pressure and more potential for mispricing.
The scenarios that produce race winners from outside the top three are well-defined: safety car timing that benefits a driver on an alternative strategy, rain that equalises car performance, a first-lap incident that eliminates frontrunners, or a tyre degradation surprise that punishes the expected leaders. Each of these scenarios has a quantifiable probability at each circuit, and my pre-race analysis estimates the combined probability of at least one of them occurring and benefiting a specific midfield driver.
My selection criteria for midfield race-winner bets are strict. The driver must show practice pace within four tenths of the leaders on long runs. The circuit must have a disruption probability above 40% (based on safety car rates, weather history, and first-corner incident data). And the price must imply a win probability at least 30% lower than my own assessed probability after accounting for disruption scenarios. When all three criteria align, I place the bet. When they don’t, I pass – even if the driver is a name I like or the circuit feels like it could produce chaos. The podium finish market offers a complementary approach for these selections: if the midfield driver is a realistic winner at the right price, they’re almost certainly a strong podium bet at shorter odds with a higher strike rate.
How often does the pole-sitter win the F1 race?
Across the past five seasons, the pole-sitter has won approximately 40-45% of races overall. This rate varies significantly by circuit: at tracks where overtaking is difficult, such as Monaco or Hungary, the conversion rate can exceed 70%. At power circuits with long straights, such as Monza or Baku, it drops below 35%.
What happens to my race winner bet if the result changes after a post-race penalty?
Most UK bookmakers settle race-winner bets on the official FIA classification, which includes any time penalties or disqualifications applied before the results are declared final. If a driver crosses the line first but is subsequently disqualified, the next classified driver becomes the winner for betting purposes.
Are race winner odds available for every Grand Prix on the calendar?
Yes. Every UKGC-licensed bookmaker offers race-winner markets for all Grand Prix events on the F1 calendar, including sprint weekends. The market typically opens mid-week before the race and remains available until the race starts, with odds updating throughout the weekend as practice, qualifying, and weather data becomes available.
Prepared by the f1 Betting editorial staff.