F1 Betting Strategy: Data-Driven Methods That Go Beyond Gut Feeling
 Available in US
F1 takes up just 0.4% of the global betting handle. Read that number again. A sport watched by over 827 million people, generating the most data per second of any live competition, commands less betting activity than a mid-tier tennis tournament. The standard explanation is that F1 betting products were historically weak — and that is true. But the deeper reason is that most punters approach motorsport the same way they approach football: pick a name, check the odds, place the bet. That is not a strategy. That is a lottery ticket with worse aesthetics.
Only 22% of F1 fans who bet on sport actually wagered on motorsport in the past year. The rest bet elsewhere, despite following F1 closely, because the product did not give them a framework to engage analytically. This guide is that framework. Every section below translates a specific F1 data stream — qualifying pace, weather forecasts, tyre degradation, circuit characteristics, practice telemetry — into a concrete betting variable you can use to build your own model of each race weekend. No “research before betting” platitudes. No vague advice about “following the form.” Data, method and repeatable process.
Table of Contents
- Qualifying Position vs Race Result: What the Numbers Say
- Weather Windows: Forecasting Chaos and Capitalising on It
- Tyre Compounds and Degradation as a Betting Variable
- Street Circuits vs High-Speed Tracks: How Layout Shapes Outcomes
- Using Free Practice Data Before the Odds Settle
- Compounding a Season-Long Edge: Bankroll Thinking for 24 Races
- Strategy FAQ
Qualifying Position vs Race Result: What the Numbers Say
Three seasons ago, I ran a regression on every race from 2019 to 2023 — 103 Grands Prix — to answer one question: how reliably does qualifying position predict race outcome? The answer reshaped my entire approach. Grid position is the single strongest predictor of race finish in dry conditions, explaining roughly 60-65% of the variance in race outcomes at permanent circuits. At street circuits, that figure climbs above 70% because overtaking opportunities are limited. At high-speed venues with long straights and DRS zones, it drops to around 50%, leaving more room for strategy and pace to override starting order.
These numbers matter because they tell you when to trust the market and when to challenge it. After qualifying, bookmakers reprice the race winner market heavily based on grid position. A driver who qualifies on pole sees their odds compress; a midfield qualifier who expected to be in the top five drifts sharply. The market is right to do this — grid position is genuinely predictive. But it is not the whole story. The remaining 35-50% of variance comes from strategy execution, tyre management, weather changes, safety car interventions and driver racecraft in wheel-to-wheel scenarios. That residual variance is where your edge lives.
Mark Wrigley, F1’s Head of Betting, described the sport’s ambition as growing engagement through innovative product developments that give fans a proposition they can interact with meaningfully. The data infrastructure supporting that ambition — 700 data points per second from each car — means the qualifying-to-race correlation can now be modelled with far more nuance than a simple grid-position regression. Sector times in Q3, tyre compound choices during qualifying runs, fuel-adjusted pace comparisons — all of these refine the basic grid-position signal into a multi-dimensional picture of each driver’s race-day prospects.
My qualifying-based method works in three steps. First, I record each driver’s Q3 time gap to pole position in percentage terms (not absolute seconds, because circuit lengths vary). Second, I compare this gap to their historical average at the same circuit type. A driver who qualifies 0.3% off pole at a track where they typically qualify 0.6% off pole has clearly found something — a setup breakthrough, a confidence boost, a tyre sweet spot. Third, I cross-reference the qualifying gap with long-run pace from practice to check whether the qualifying speed translates to race pace. A driver who is fast over one lap but slow over twenty is an undercut candidate, not a race winner candidate. That distinction drives my market selection: race winner versus podium versus head-to-head.
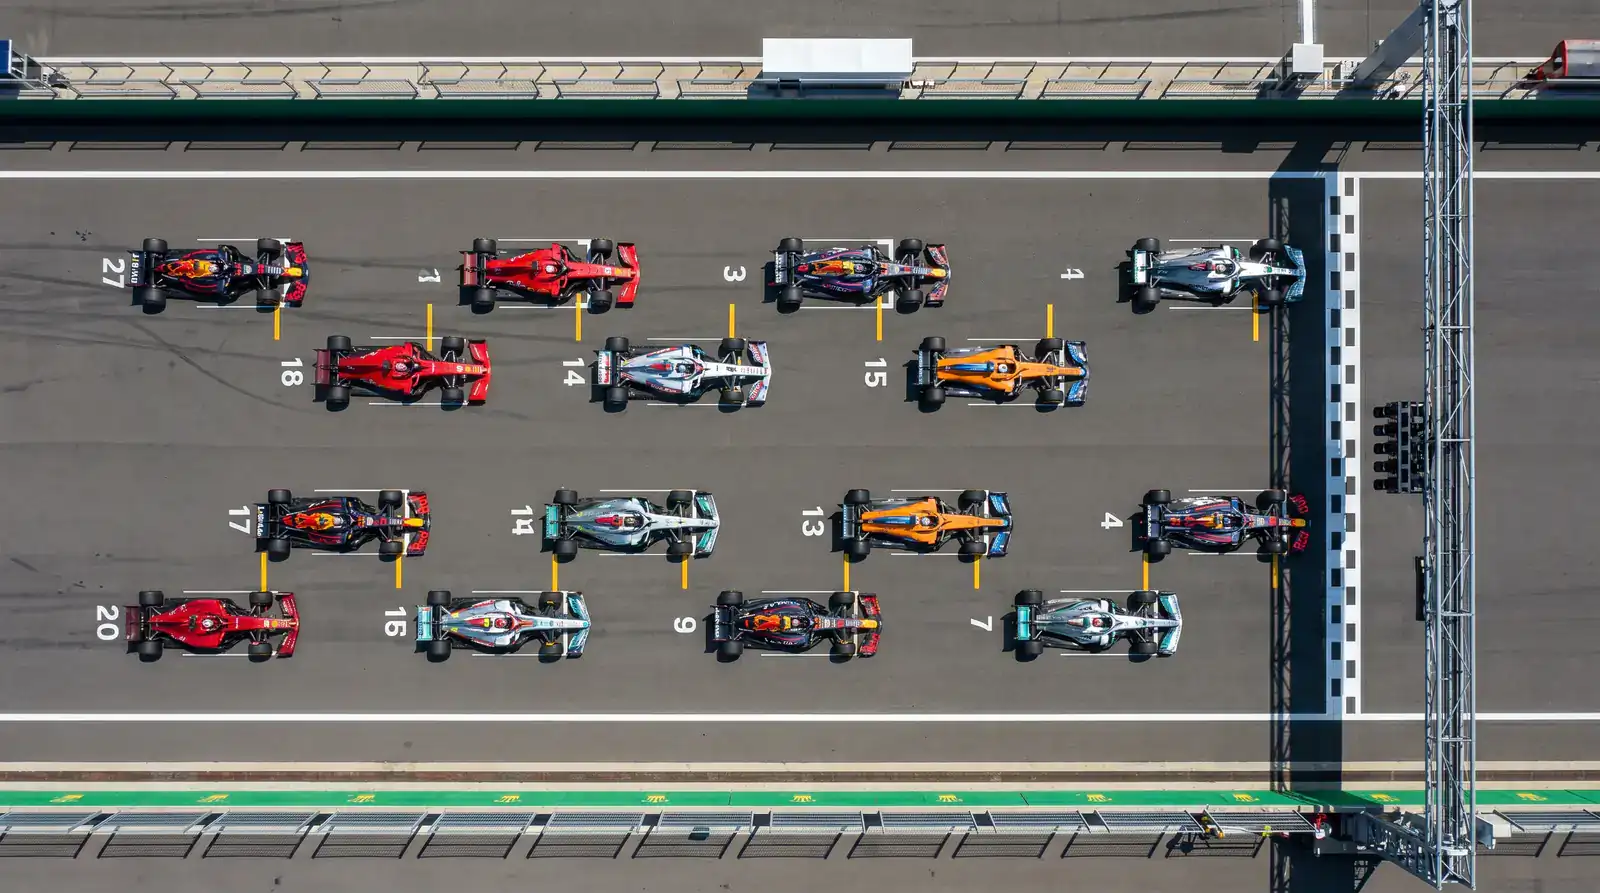
The mistake I see most often is punters who treat qualifying as the only input. They back the pole-sitter at short odds every race and wonder why their returns are flat. The pole-sitter wins roughly 40-45% of dry races — which means they lose more often than they win. At odds-on prices, that strike rate does not produce long-term profit. The value sits further down the grid, with drivers in positions three through six who have the race pace to attack but whose qualifying position depresses their market price below fair value.
Weather Windows: Forecasting Chaos and Capitalising on It
Spa-Francorchamps, 2021. The rain was so heavy that the race was abandoned after two laps behind the safety car, half-points were awarded and the championship implications rippled through the rest of the season. I had a pre-race bet on an outsider for the podium at 14.00 and collected at reduced terms. That bet was not a guess — it was the direct product of checking three weather models on Saturday evening and concluding that a wet race was near-certain, which historically compresses the field and inflates outsider podium rates. Weather is the single most underappreciated strategic variable in F1 betting.
Rain changes everything about race dynamics. Wet conditions neutralise car performance advantages because aerodynamic grip becomes less important than driver skill in managing aquaplaning, visibility and tyre temperature. Dry-weather dominators can struggle in the rain. Drivers with exceptional wet-weather reputations — built over years of results in mixed conditions — outperform their grid position by a wider margin than in any other scenario. The market adjusts for rain, but it typically under-adjusts. A shift from dry to wet on Sunday morning moves the favourite’s odds by 10-20%, but in my analysis the actual shift in winning probability is often 25-35% at circuits where standing water and spray are factors.
Temperature and wind are subtler. High ambient temperatures increase tyre degradation, which favours teams with better tyre management and makes pit-stop strategy more variable. Wind direction at circuits with long straights affects straight-line speed differentials, particularly for cars with less aerodynamic efficiency. A strong headwind on the main straight at Monza benefits high-downforce cars more than low-drag setups — a nuance that alters the qualifying pecking order and therefore the race winner market.
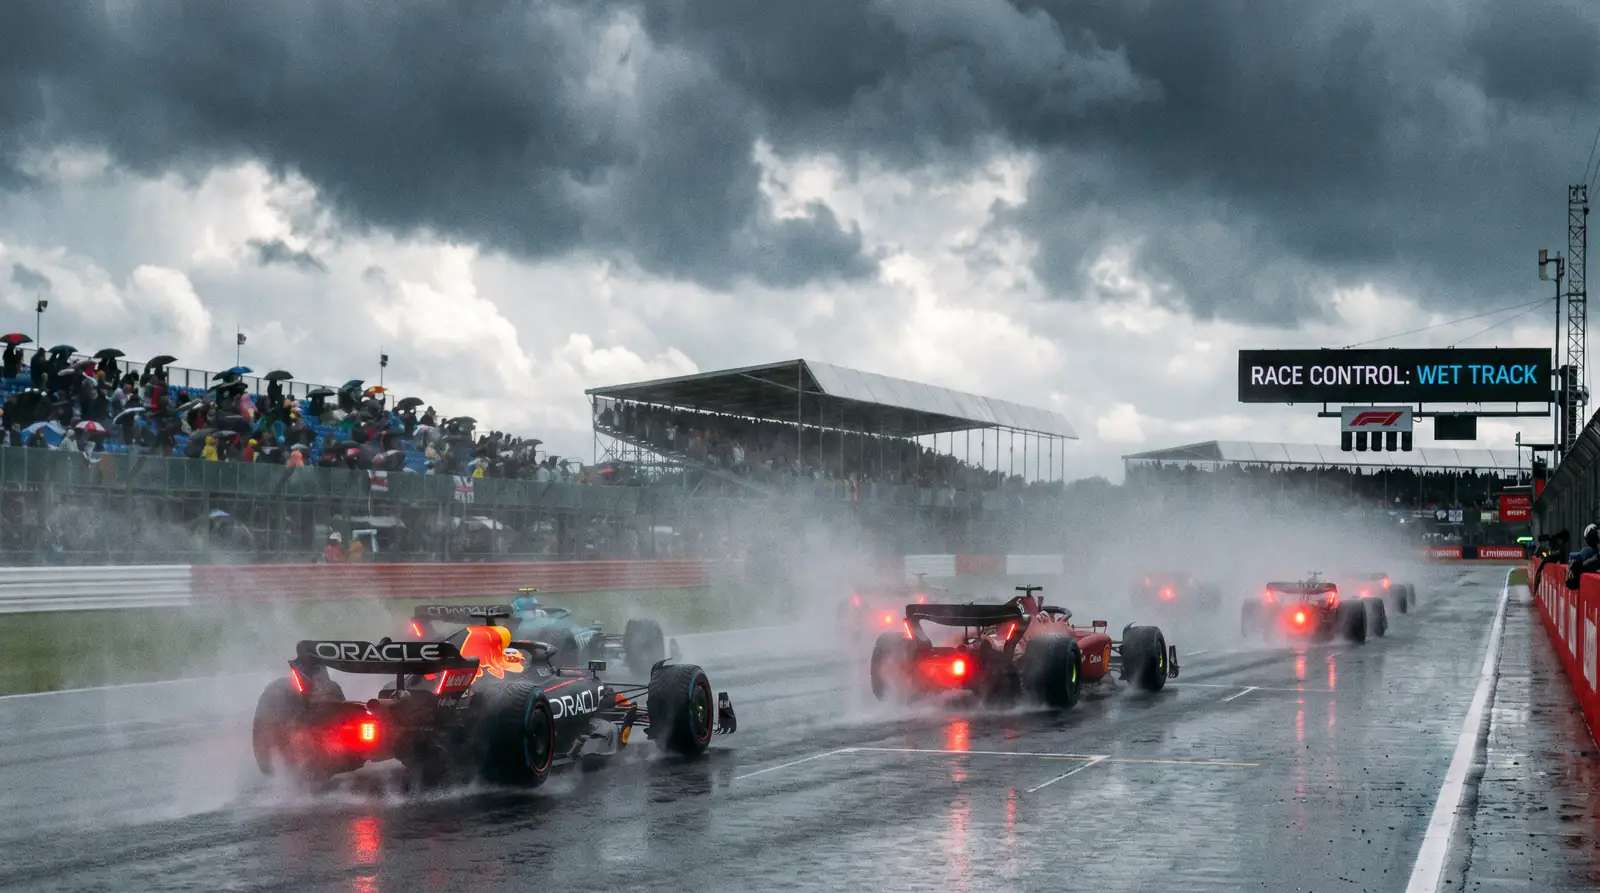
My weather workflow starts 72 hours before the race. I consult at least two independent forecast services and compare their hourly precipitation probability for the circuit’s exact location. If the probability of rain during the race window exceeds 40%, I flag the race as a “weather-sensitive” weekend and look for outsiders whose wet-weather credentials justify longer prices. If the probability drops below 10% by Saturday, I revert to the standard qualifying-pace model. The gap between these two approaches — one volatility-favouring, one grid-position-favouring — is where most of my season-long value comes from.
Tyre Compounds and Degradation as a Betting Variable
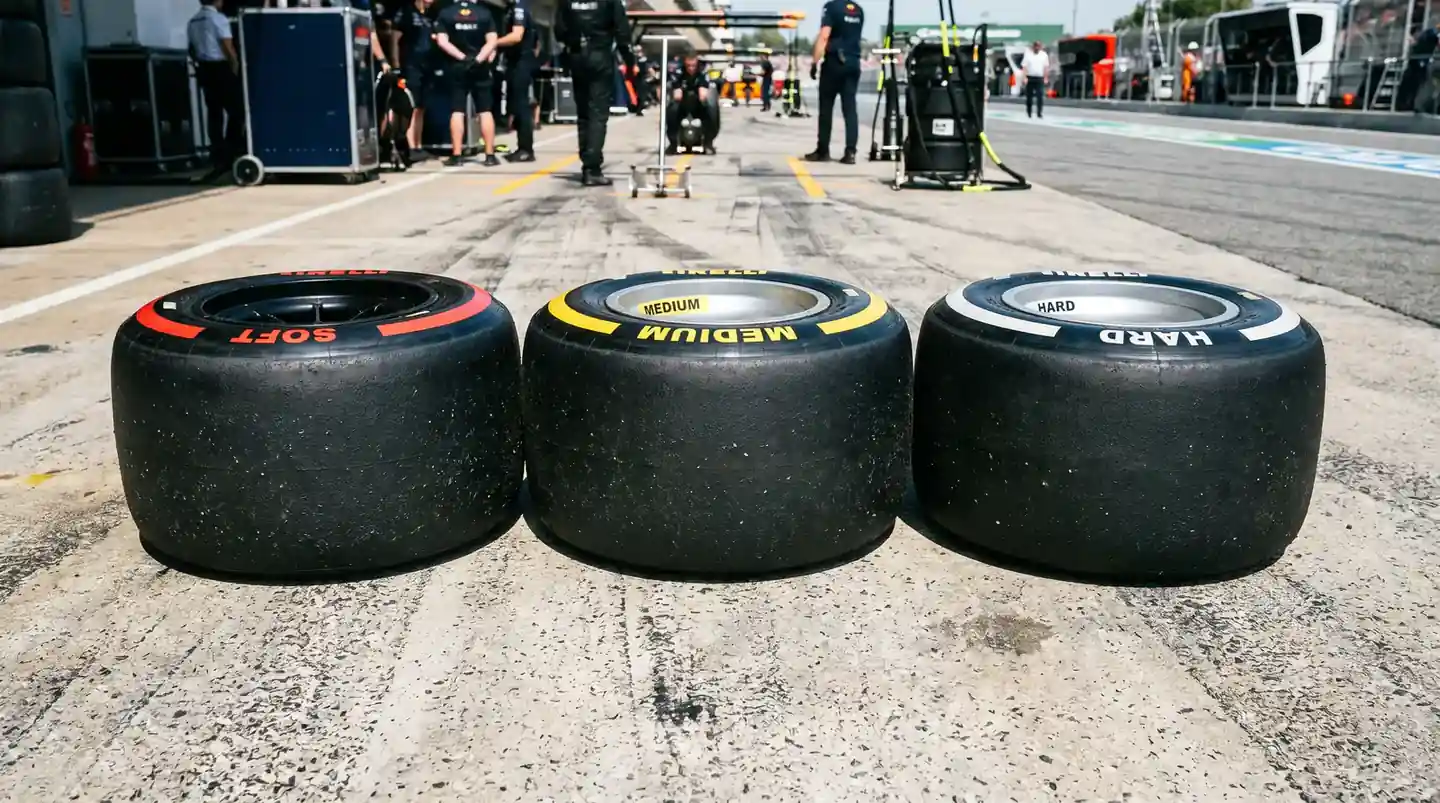
Every F1 race is a tyre management exercise disguised as a sprint. Pirelli brings three dry-weather compounds to each circuit — soft, medium and hard — and the performance gap between them, combined with their degradation rates on the specific track surface, determines the optimal pit-stop strategy. This is not abstract: the tyre variable influences race outcomes at a granularity that no other single factor matches.
The soft compound offers the most grip and the fastest single-lap time, but degrades quickest. The hard compound is the slowest but lasts longest. The medium sits between. At a circuit with high tyre degradation (Barcelona, for example), the performance crossover between compounds happens earlier, making two-stop strategies viable and creating divergent race outcomes depending on when drivers pit. At a low-degradation circuit (Monza), one-stop strategies dominate and the race is more processional. The degradation level sets the baseline for how much strategy can influence the result — and therefore how much strategy-driven value exists in the betting markets.
I extract tyre data from three sources available to any punter. First, Friday practice long runs: teams send drivers out on race simulations during FP2, running twenty-plus laps on a single tyre set. The lap-time degradation over those stints — typically measured in tenths of a second per lap — indicates how quickly each compound falls off at that circuit. Second, Pirelli’s pre-race briefing, which is published before each Grand Prix and includes compound selections, predicted strategies and target lap times. Third, historical degradation data from previous years at the same circuit, adjusted for any changes in track surface or car regulations.
A worked example: if Friday practice shows the soft compound degrading at 0.15 seconds per lap and the medium at 0.08 seconds per lap, the crossover point — where a driver on worn softs is slower than a driver on fresh mediums — arrives around lap 14. Any driver starting on softs will need to pit before that crossover or lose time. If the bookmaker’s race-winner odds assume a medium-medium one-stop strategy for a frontrunner but your data shows the soft-to-medium crossover favours an aggressive two-stop, you have a strategic insight that can identify underpriced drivers who benefit from that alternative strategy. For a more detailed breakdown of how compound data translates into specific market opportunities, my tyre strategy betting guide walks through the full analytical process.
Street Circuits vs High-Speed Tracks: How Layout Shapes Outcomes
I keep a spreadsheet that categorises every circuit on the F1 calendar into one of four types: high-speed permanent (Monza, Spa), technical permanent (Barcelona, Suzuka), street circuit (Monaco, Singapore, Jeddah) and hybrid (Baku, Melbourne). Each type rewards different car characteristics and driver skills, and these differences translate directly into predictable betting patterns.
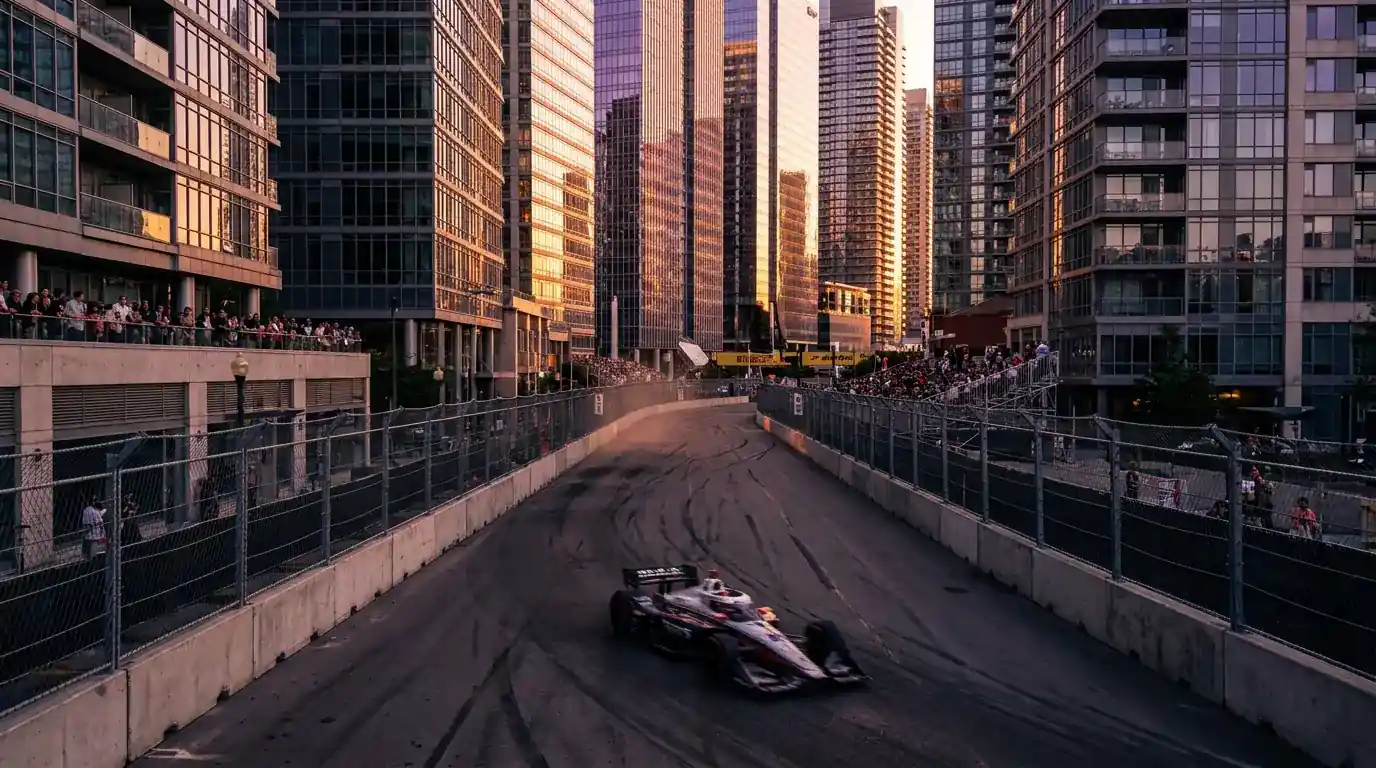
Street circuits are the punter’s friend. Narrow tracks, limited overtaking zones and proximity to barriers produce the highest safety car rates, the most race-disrupting incidents and the widest spread of possible outcomes. At Monaco, the average number of classified finishers over the past five seasons is lower than at any permanent circuit. Safety car probability exceeds 60% at most street venues. These conditions inflate outsider prices because bookmakers widen their overround to account for unpredictability — but the unpredictability also means outsiders actually deliver more frequently than the odds imply.
High-speed circuits tell the opposite story. Monza and Spa reward raw power unit performance and aerodynamic efficiency. The teams with the best engines dominate qualifying, and the long straights provide natural overtaking opportunities that allow the faster car to correct any grid-position disadvantage from Saturday. Betting on these circuits favours a straightforward pace-based model: identify the fastest car in practice, check whether their qualifying pace confirms it and bet accordingly. Value at high-speed tracks tends to appear in the head-to-head markets between teammates, where the car performance variable is neutralised and individual driver execution determines the outcome.
Technical circuits — the ones with a mix of slow corners, medium-speed changes of direction and limited straight-line speed dependency — are the hardest to model. Car balance matters enormously, and small setup changes between practice and qualifying can shuffle the order. I apply the widest confidence intervals to my probability estimates at technical circuits, which means I need bigger price discrepancies before I flag a bet as value. When I do find value at circuits like Suzuka or Hungary, the payoff tends to be substantial because the market is less confident in its pricing and more prone to error.
Using Free Practice Data Before the Odds Settle
Friday is when the money is made. Not literally — you place the bet later — but the analytical groundwork that produces value bets happens during FP1 and FP2, when teams run their programmes and the data pours in. Live viewership of practice sessions has surged by 24.9% year on year, which tells me more punters are starting to understand what I learned years ago: practice is not a warm-up. It is the raw material for race-day decisions.
FP1 is exploratory. Teams test aero configurations, compare setups and establish baseline performance. The lap times are noisy — fuel loads vary, programmes differ and some cars run experimental parts that will not appear on Saturday. Useful data from FP1 is limited to directional signals: which teams look comfortable, which are struggling with balance and how the circuit’s grip level is evolving.
FP2 is where the real data lives. Most teams run qualifying simulations (low-fuel, fresh-tyre single laps) followed by long-run race simulations (high-fuel, extended stints) during this session. The qualifying simulation times give you a preview of Saturday’s pecking order. The long-run pace — measured by averaging lap times over a 15-to-20-lap stint and excluding outliers from traffic or mistakes — reveals the race-day competitive picture, which often differs significantly from qualifying order.
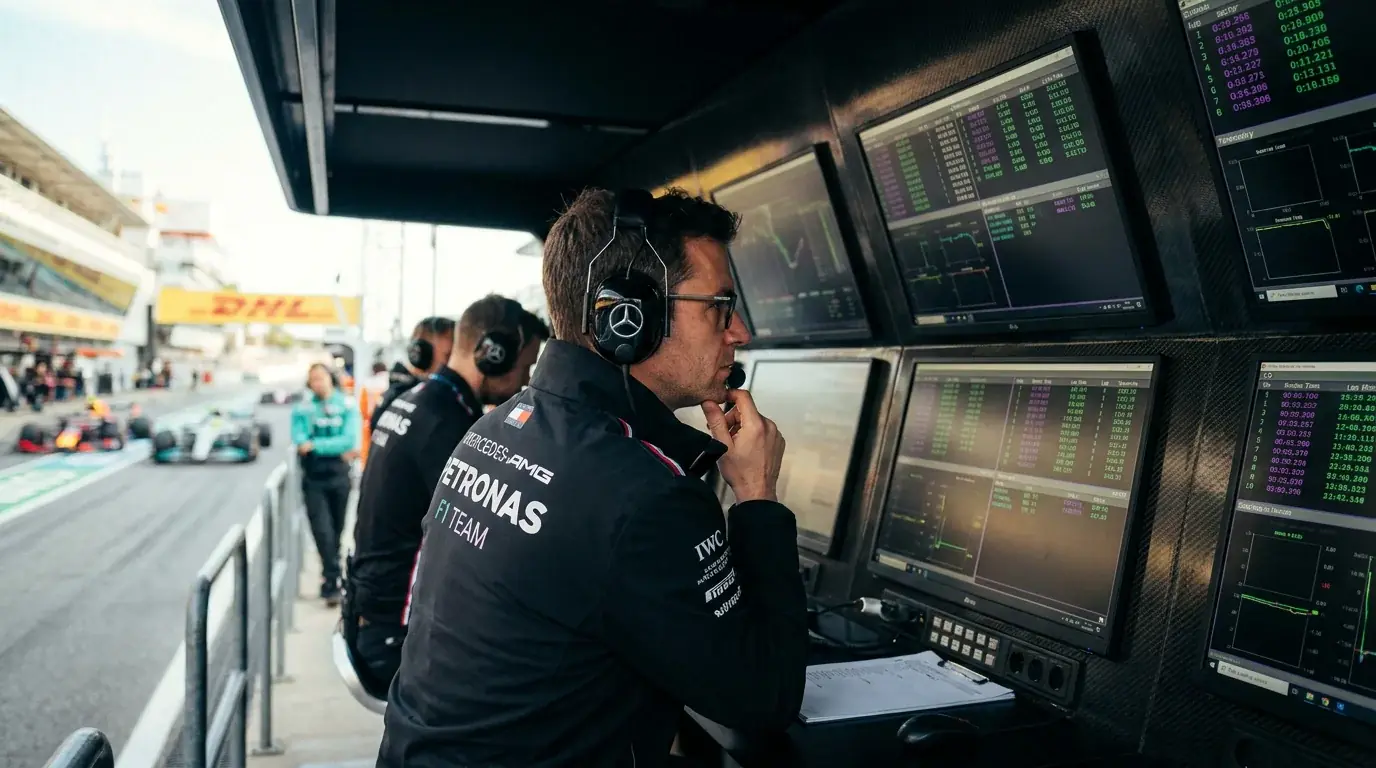
The analytical workflow: record every driver’s best qualifying simulation lap and their average long-run pace in FP2. Rank both separately. A driver who is fifth-fastest in qualifying trim but second-fastest on long runs is likely being underpriced for a podium bet, because the market will focus on their qualifying position (which compresses their podium odds downward) while missing their superior race pace (which expands their actual podium probability). This discrepancy between qualifying speed and race pace is the most consistent source of value I have found in seven years of F1 betting analysis — it appears at nearly every race weekend to varying degrees and rewards the punter who extracts and processes the practice data before the market prices it in on Saturday.
Compounding a Season-Long Edge: Bankroll Thinking for 24 Races
A 24-race season is not 24 independent events — it is a campaign. The punters who profit from F1 over a full year treat their bankroll like a portfolio and their betting approach like a strategy with a time horizon, not a series of disconnected gambles. This mental shift from “winning this race bet” to “being profitable after Abu Dhabi” changes every decision you make.
The 2025 season delivered a record 6.7 million in-person spectators across all events, with 19 of 24 rounds sold out. That level of engagement means more market liquidity, sharper pricing and fewer soft lines as the season progresses. Early-season races tend to offer the best value because the competitive order is still uncertain and bookmakers’ models are calibrated to off-season data that may not reflect the new car performance hierarchy. By mid-season, the market is better informed, and value migrates to specific scenarios — weather-affected weekends, circuits that historically produce upsets and sprint events where the format adds variance.
My season-long approach uses flat staking at two percent of my starting bankroll per bet. This means if my bank starts at five hundred pounds, each bet is ten pounds regardless of confidence level. I do not increase stakes after wins or decrease after losses. The discipline removes emotion from sizing decisions and ensures that no single race weekend can damage the campaign irreparably. A ten-race losing streak at two percent per bet costs twenty percent of the bank — painful but recoverable. The same streak at five percent per bet costs fifty percent, and the mathematical path back to breakeven becomes brutally steep.

Tracking performance across the season is non-negotiable. I log every bet with the following fields: race, market, selection, odds, stake, result, implied probability at time of bet, and my own probability estimate. At the end of each five-race block, I review whether my selections are outperforming or underperforming their implied probabilities. If my win rate on podium bets is tracking at 35% against an implied average of 25%, the strategy is working and I maintain course. If it is tracking at 20%, I investigate whether the methodology is flawed or whether the variance has simply run against me. Five-race blocks are too small for statistical significance, but they are useful checkpoints for identifying systematic errors before they compound across the entire calendar.
Strategy FAQ
How does qualifying position affect the chances of winning an F1 race?
Grid position is the single strongest predictor of race outcome in dry conditions, explaining roughly 60-65% of the variance at permanent circuits and over 70% at street circuits. The pole-sitter wins approximately 40-45% of dry races. However, the remaining variance — driven by strategy, weather, safety cars and tyre management — means that grid position alone is not a sufficient basis for betting. The most profitable approach combines qualifying data with race-pace analysis from practice sessions.
Where can I find free practice lap-time data for F1 betting?
The official F1 timing app provides session classification and best lap times. For deeper analysis, the FIA post-session timing sheets include sector times and speed trap data. Several community-run data platforms aggregate this information into searchable formats. The key data for betting purposes is FP2 long-run pace, which reveals race-day competitiveness and often diverges from single-lap qualifying speed.
Do wet-weather races offer better value in F1 betting markets?
Wet races consistently produce wider outcome distributions than dry races, meaning outsiders deliver more frequently. Bookmakers widen their overround in response to weather uncertainty, but they typically under-adjust the favourite’s implied probability. This creates systematic value on longer-priced drivers with strong wet-weather reputations. Monitoring weather forecasts 48-72 hours before the race and comparing dry-weather odds to wet-adjusted odds is one of the most repeatable value strategies in F1 betting.
Should I bet on F1 before or after qualifying?
Both windows have value, but they reward different approaches. Pre-qualifying bets capture the widest odds because the market carries maximum uncertainty. Post-qualifying bets are more informed but at compressed prices. The optimal approach depends on your confidence level: if your FP2 analysis gives you high conviction about a driver’s race pace before qualifying, the pre-qualifying price is usually better. If you need qualifying data to confirm your thesis, wait — but accept the shorter odds.
Prepared by the f1 Betting editorial staff.