F1 Betting Odds Explained: Fractional, Decimal and How to Spot Value
 Available in US
Formula 1 accounts for just 0.4% of the global betting handle — a figure that sounds absurd when you consider the sport attracts over 827 million fans worldwide and sits at the centre of a $133 billion sports wagering market. I have spent seven years dissecting F1 odds for a living, and the gap between fan engagement and betting activity tells me one thing: most people who want to punt on motorsport are put off by the numbers on their screen. They see 11/4 next to a driver’s name and freeze.
That ends here. This guide breaks down how F1 odds actually work — fractional, decimal and the implied probability sitting behind both formats. More importantly, it shows you how to read those numbers critically, spot the margin bookmakers bake in and identify the moments when the price on offer genuinely exceeds the risk. Whether you have placed hundreds of F1 bets or none at all, understanding odds is the single skill that separates punters who grind out long-term returns from those who just pick their favourite driver and hope.
Reading Fractional Odds on UK Betting Sites
The first F1 bet I ever placed was on Jenson Button at 14/1 for a wet race at Spa. I did not fully understand what 14/1 meant beyond “big number equals big payout.” That ignorance cost me nothing on that occasion — Button finished second — but it did cost me later, because I was picking prices without knowing what they represented. Fractional odds are still the default display on most UK betting sites, and reading them properly is step one.
A fractional price is written as two numbers separated by a slash. The number on the left is your potential profit; the number on the right is the stake required to earn that profit. At 5/1, a ten-pound stake returns fifty pounds of profit plus your ten-pound stake back, totalling sixty. At 2/1, the same tenner returns twenty profit plus stake, totalling thirty. The maths never changes: multiply your stake by the left number, divide by the right number and you have your profit.
Where things get interesting is with “odds-on” prices — fractions where the right number is larger than the left. A driver priced at 4/7 is the market favourite. Your profit on a ten-pound stake is ten multiplied by four, divided by seven: five pounds and seventy-one pence. You risk more than you stand to win, which reflects the bookmaker’s assessment that this outcome is more likely than not. In a 20-driver F1 field, odds-on prices typically appear only on dominant cars during seasons of clear superiority.
One detail that trips up newcomers: 11/8 and 6/4 look different but sit in the same neighbourhood. Converting both to profit-per-pound-staked makes comparison instant. At 11/8, every pound returns one pound and thirty-seven pence profit. At 6/4, every pound returns one pound fifty. That thirteen-pence gap matters across a full season of bets, and fractional odds make it harder to spot at a glance than it needs to be. I use fractional odds for quick mental benchmarks — anything above 3/1 is a longer shot, anything below evens is heavily fancied — but for serious comparison work, I switch format entirely.
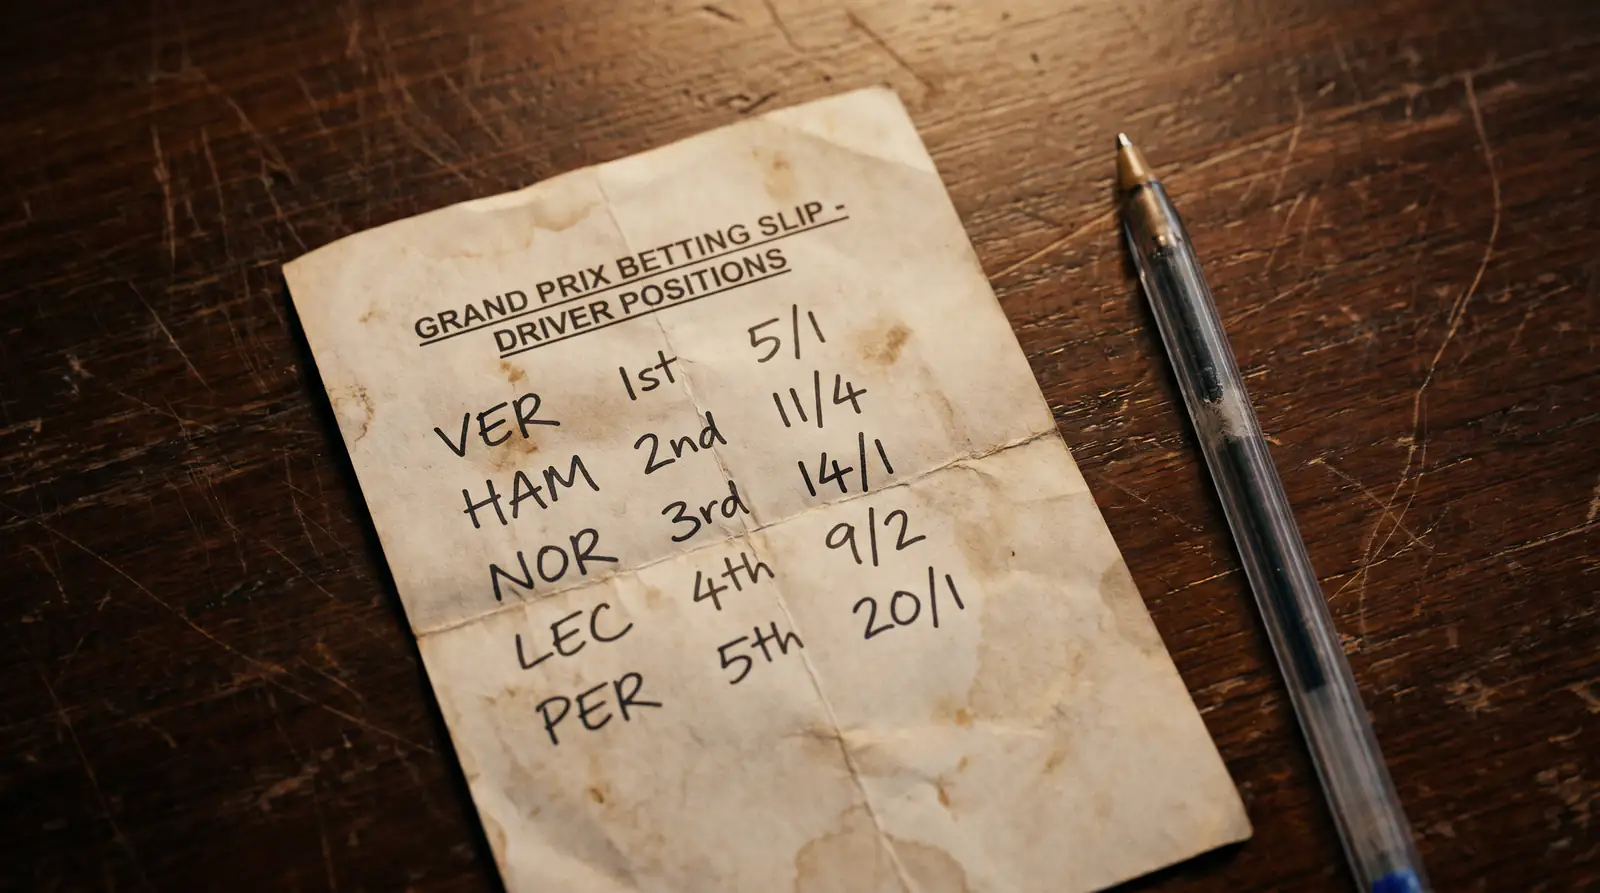
UK bookmakers display fractional by default because of tradition, not because the format is superior. The strength of fractional odds is cultural familiarity. The weakness is arithmetic friction. When you are comparing five different bookmakers’ prices on a race winner market with twenty drivers, converting 11/4 versus 13/5 versus 5/2 in your head wastes time you could spend analysing the race itself. That friction is exactly why the decimal format exists.
Decimal Odds and Why Some Punters Prefer Them
I switched to decimal odds about four years into my F1 analysis work, and the immediate effect was embarrassing — I realised how many bad comparisons I had been making in fractional format. Decimal odds express your total return per pound staked in a single number. A price of 3.75 means a one-pound bet returns three pounds seventy-five, including your original stake. Your profit is 2.75. No slash, no mental gymnastics.
The conversion from fractional to decimal is straightforward: divide the left number by the right number and add one. So 5/2 becomes (5 divided by 2) plus 1, which equals 3.50. The beauty of decimal is that comparison becomes instant. Is 3.75 better than 3.50? Obviously. Is 11/4 better than 7/2? You need a few seconds longer to confirm. Over a 24-race calendar with multiple markets per weekend, those seconds compound into a meaningful analytical advantage.
Decimal odds also make it trivially easy to calculate your total return. Stake multiplied by decimal odds equals total payout. Twenty pounds at 4.00 pays eighty. Twenty pounds at 1.57 pays thirty-one forty. The format was designed for exchanges and European markets, but it has become standard on every major UK platform — you just need to toggle the display in your account settings. Most experienced F1 punters I know work exclusively in decimal, switching to fractional only when discussing odds casually. I would recommend the same approach for anyone serious about motorsport betting.
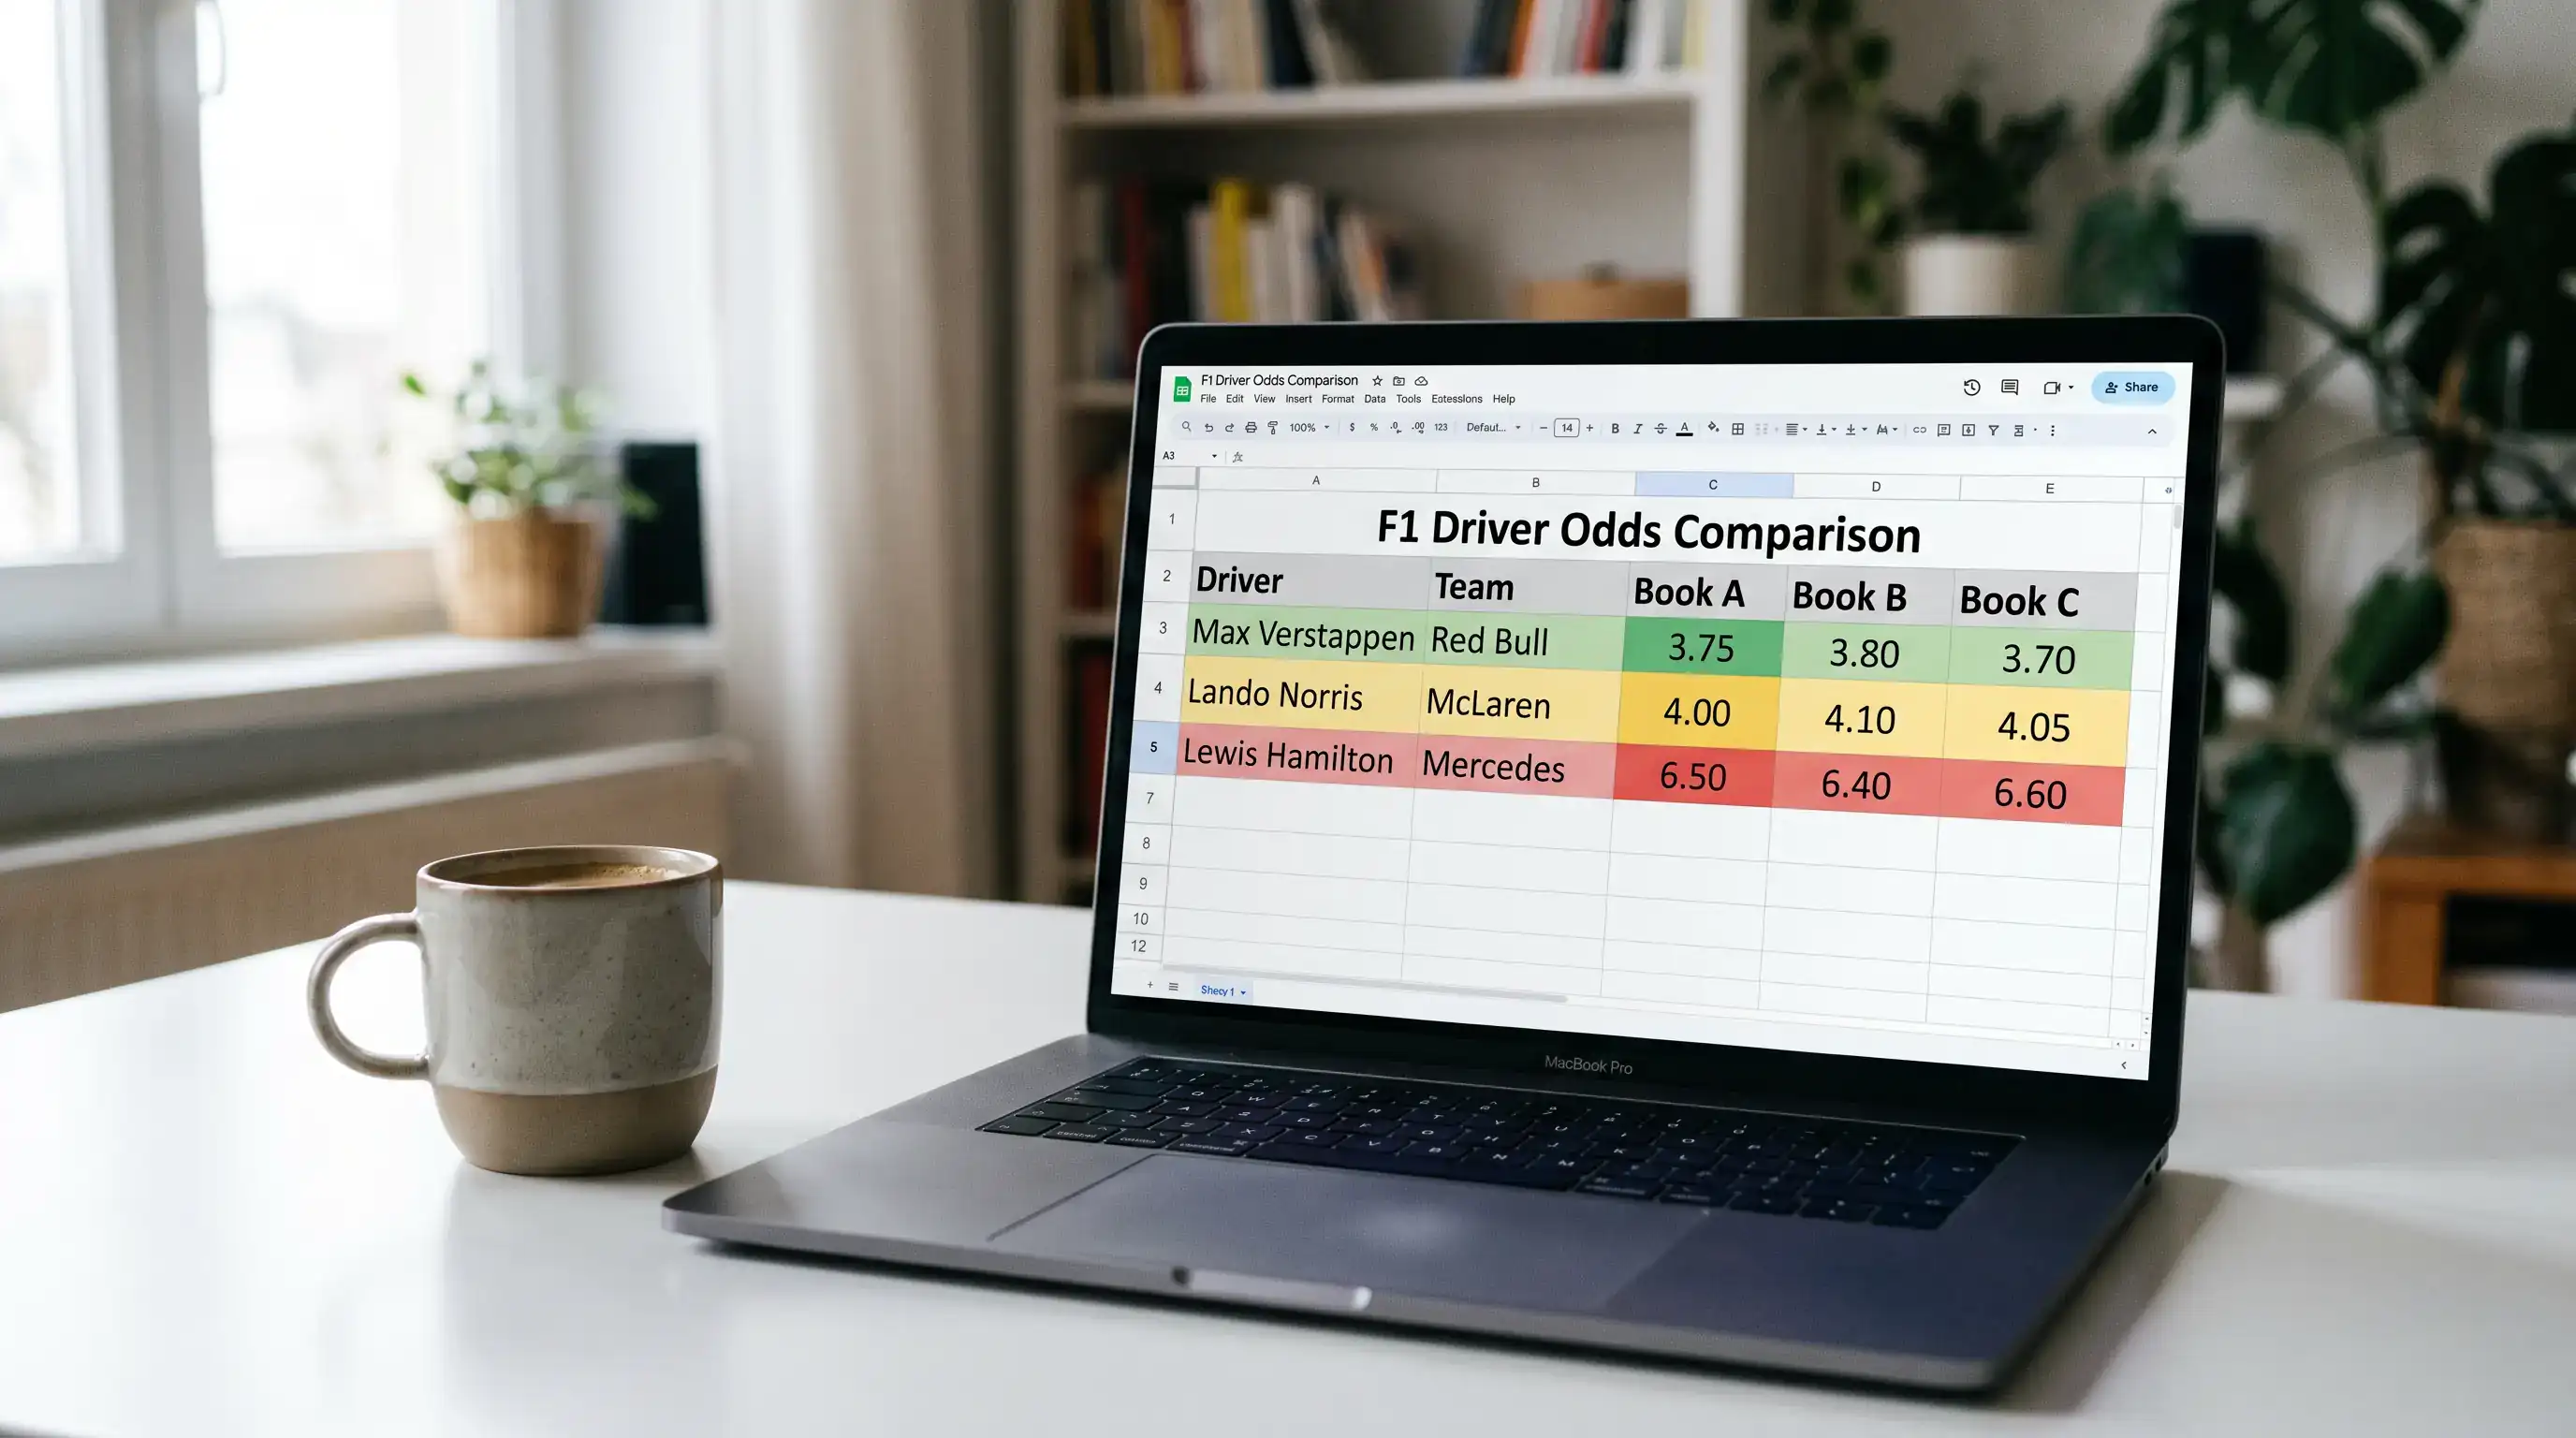
One thing to watch: decimal odds of 2.00 are equivalent to evens (1/1). Anything below 2.00 means you are betting on a favourite and your profit is less than your stake. Anything above 2.00 and profit exceeds your stake. That 2.00 line is the quickest mental anchor available in any odds format, and it is one reason decimal dominates professional betting circles.
Implied Probability: Turning Odds into Percentages
Here is the question that changed how I approach F1 betting entirely: what percentage chance does the bookmaker think this driver has of winning? That question is what implied probability answers, and once you learn to ask it instinctively, every price on your screen becomes a claim you can agree with or argue against.
The formula is simple. For decimal odds, divide one by the decimal price and multiply by one hundred. A driver at 4.00 has an implied probability of 25%. A driver at 2.50 sits at 40%. A heavy favourite at 1.50 is priced as if they have a 66.7% chance. For fractional odds, the formula is the right number divided by the sum of both numbers, multiplied by one hundred. At 3/1, that is 1 divided by (3 plus 1), which gives 25%. Same result, different route.
Why does this matter for F1 specifically? Because a 20-driver field creates a far wider spread of implied probabilities than a two-horse race or a football match. In a typical Grand Prix race winner market, the favourite might sit at 30% implied probability, two or three contenders at 12-18% each, a midfield cluster between 3% and 8% and the backmarkers at 0.5-1.5%. That distribution is the bookmaker’s model of the race, expressed entirely through numbers.
Now comes the critical step: comparing those implied probabilities to your own assessment. If you believe a driver has a 15% chance of winning based on qualifying pace, track layout and strategy options, but the bookmaker prices them at 8% implied probability (decimal odds of 12.50), you have found a potential value bet. The price is higher than your model suggests it should be. Conversely, if the market implies 30% and you think 25%, the price is too short for your analysis.
I track implied probabilities for every race weekend in a spreadsheet, recording the opening implied probability on Wednesday, the pre-qualifying number on Friday evening and the final pre-race figure on Sunday morning. Over three seasons, this tracking has shown me consistent patterns: implied probabilities compress after qualifying (favourites get shorter, outsiders drift) and then shift again on Sunday morning based on weather forecasts and tyre allocation decisions. The punters who extract value from F1 markets are the ones who form their probability estimates before these shifts happen, then act when the market moves toward their number rather than away from it.
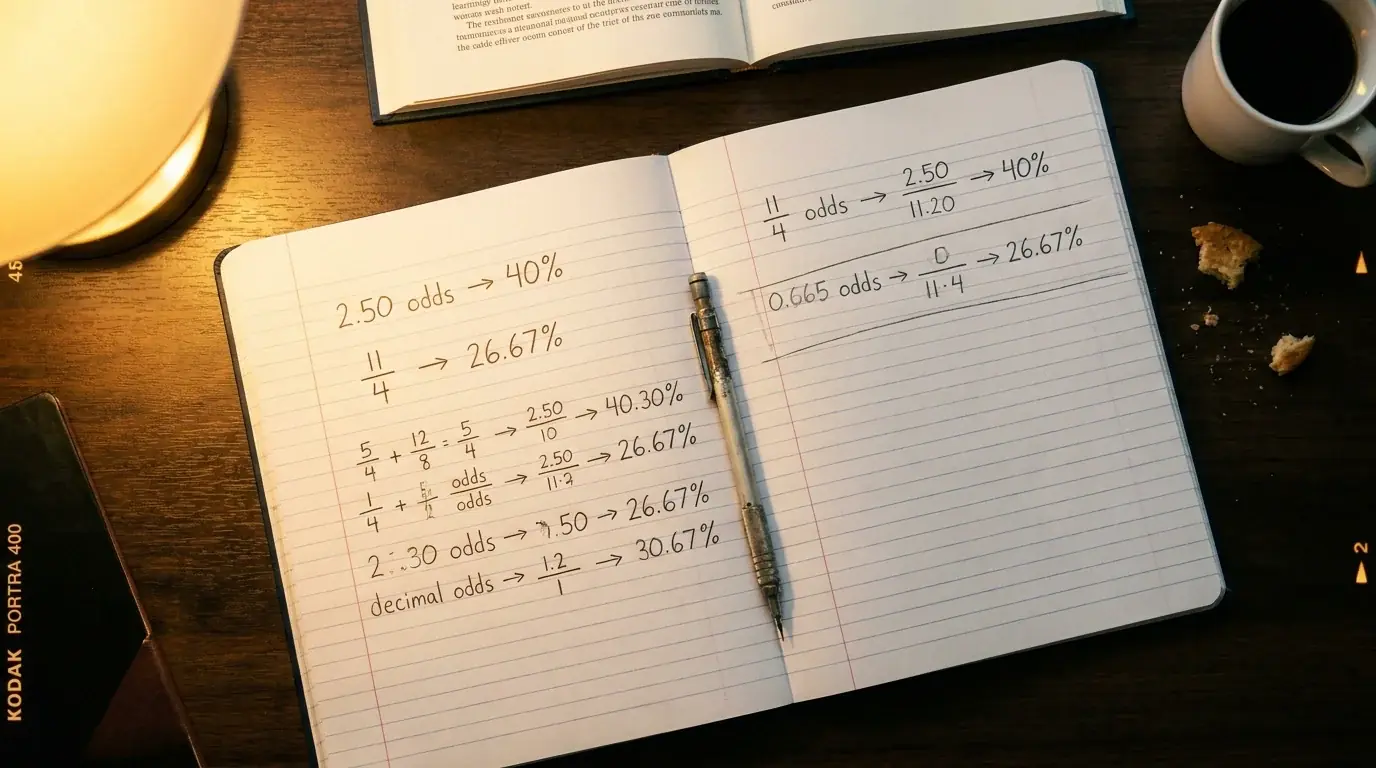
One practical tip: do not get bogged down in decimal places. If your estimated probability and the implied probability are within two or three percentage points, there is no meaningful edge. The margins in F1 betting are wide enough that value tends to appear in five-plus percentage point gaps. A driver you rate at 20% who is priced at 10% — that is a screaming value play. A driver you rate at 20% priced at 17% — that is noise. Learning to distinguish the two saves time and bankroll.
The Overround: How Bookmakers Build Their Margin
Add up all the implied probabilities in an F1 race winner market and you will not get 100%. You will get something closer to 115-130%, depending on the bookmaker and the market. That surplus is called the overround, and it is the mechanism through which every bookmaker guarantees themselves a margin regardless of which driver crosses the line first.
Think of it this way. In a perfectly fair market, all implied probabilities sum to exactly 100% — every outcome is priced at its true likelihood, and the bookmaker makes nothing. In reality, each price is slightly lower than the true probability warrants. The favourite at a true 30% chance is priced at 27%. The 10% contender is priced at 8.5%. Stack twenty drivers worth of these small shavings and the total implied probability reaches 120% or more. That extra 20% is the house edge, baked into every single bet on the board.
The global sports betting market runs on these margins across a $133 billion annual handle. For F1 specifically, the overround tends to be higher than football or tennis markets because the sport has lower betting volume. Less liquidity means bookmakers build in wider margins to protect themselves against sharp bettors who know the sport deeply. I have seen overrounds above 140% on F1 outright championship markets early in the season — effectively a 40% house edge before you even start.
So how do you fight back? First, by being aware the overround exists. Many casual punters assume that odds are a neutral reflection of probability. They are not. They are the bookmaker’s probability estimate minus their cut. Second, by shopping across multiple platforms. The same race winner market might carry a 118% overround at one bookmaker and 125% at another. That seven-point difference translates directly into better prices for the punter. Third, by focusing on markets where the overround is thinnest — typically the most popular markets (race winner, championship outright) rather than niche props, where the bookmaker has less data and builds in wider protection.
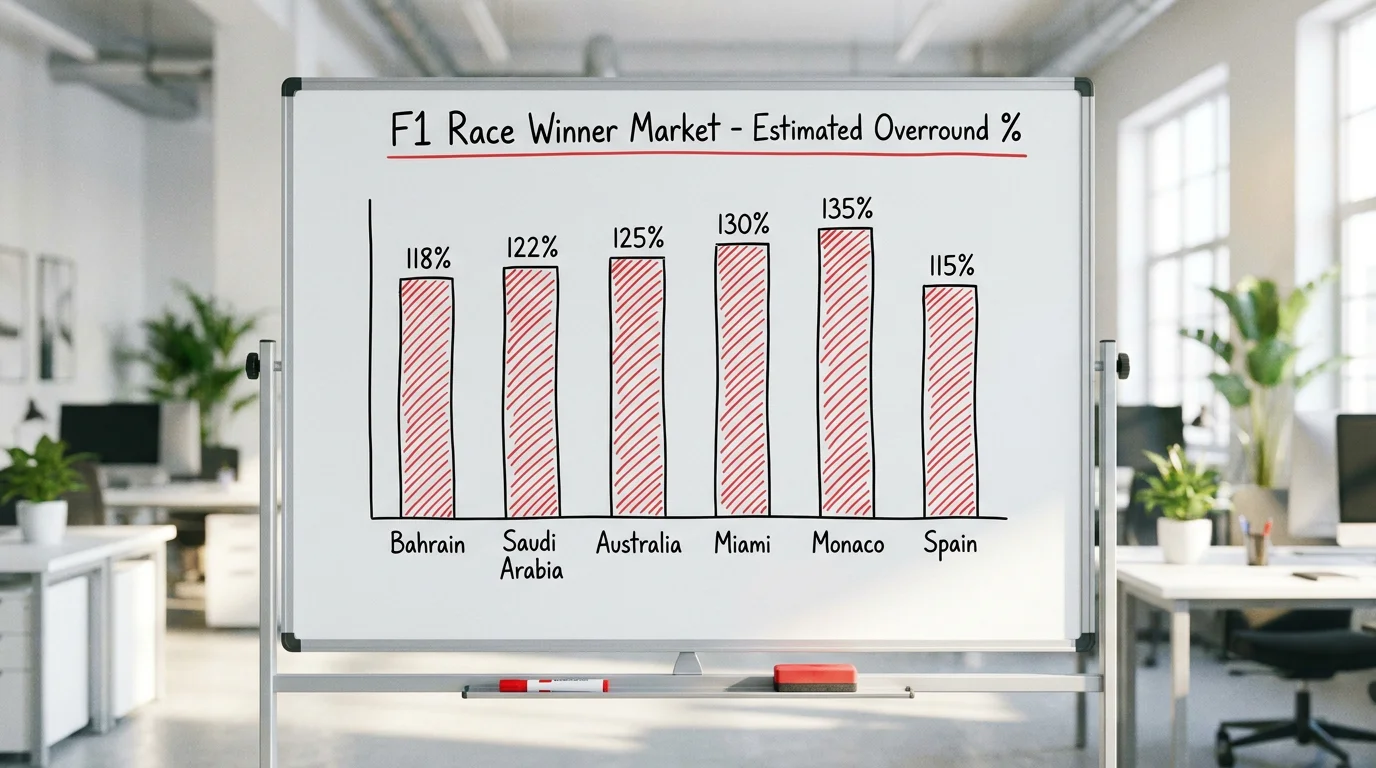
I calculate the overround for every race winner market I analyse. The process takes sixty seconds: convert every price to implied probability, sum them and subtract 100. The result is the total margin working against you. Any number below 115% is competitive for F1. Anything above 130% and I look elsewhere or wait for the market to sharpen closer to race day.
Why F1 Odds Move Before and During a Race Weekend
Last season I watched a driver’s race winner odds collapse from 17.00 to 6.50 between Friday evening and Saturday afternoon — purely because of a setup breakthrough in FP3 that translated into a front-row qualifying position. If you had placed your bet on Friday, you captured nearly three times the value of someone who waited until the grid was set. That timing dynamic is unique to F1 and it is the single biggest reason odds move so dramatically across a race weekend.
F1 odds shift in response to information, and a modern Grand Prix weekend produces more information than almost any other sporting event. Each of the 20 cars generates roughly 700 data points per second during a session — tyre temperatures, fuel loads, sector times, brake pressures, engine modes and hundreds of other telemetry channels. Bookmakers with access to official data feeds, supplied through partnerships like the ALT Sports Data agreement, process this information in real time to adjust their prices. When Mark Wrigley, F1’s Head of Betting, described the sport’s approach, he talked about spending a year working out how to convert that vast data stream into a meaningful betting product — the goal being engagement built on substance rather than guesswork.
The typical movement pattern across a weekend follows a predictable arc. Opening odds, released on Monday or Tuesday, reflect pre-weekend expectations based on historical track data, championship form and car performance trends. These are the loosest prices — bookmakers have the least information and the widest margins. After Friday practice, odds adjust based on long-run pace and single-lap speed. The biggest shift happens post-qualifying on Saturday: a driver who qualifies on pole from the second row of pre-weekend expectations will see their odds crater, while a favourite who struggles in Q2 drifts sharply.
Sunday morning brings the final pre-race adjustment. Weather is the primary driver here. A forecast shift from dry to wet can move a rain specialist’s odds by 30-50% in implied probability terms within an hour. Tyre allocation strategies become visible when teams declare their starting compounds, and this too moves prices — a driver starting on softs while the rest of the top ten choose mediums signals an aggressive one-stop intent that bookmakers price in immediately.

Then the race begins, and in-play odds become a different beast entirely. Live markets respond to position changes, pit stops, safety car deployments and mechanical issues within seconds. The data feed advantage that bookmakers hold over individual punters is at its widest during the race — they see telemetry trends before the TV broadcast shows them. Understanding this asymmetry is essential. Pre-race and post-qualifying windows are where individual analysis can most effectively compete with the market; in-play is where the house advantage in information speed is greatest.
Identifying Value in F1 Betting Odds
28% of F1 fans placed an online sports bet in the past twelve months — the highest propensity of any major sport’s fanbase. Yet only 22% of those who do bet on sport actually wagered on motorsport. That gap tells you the F1 betting market is underdeveloped relative to its audience, and underdeveloped markets are exactly where value hides. Fewer sharp bettors means less efficient pricing. Less efficient pricing means more opportunities for anyone willing to do the analytical work.
Value, in concrete terms, exists when the implied probability of an outcome is lower than its actual probability. The bookmaker says a driver has a 10% chance (decimal 10.00). Your analysis says 16%. That six-percentage-point gap is value. You will not win that bet most of the time — 16% means roughly one in six — but at the price offered, your expected return is positive over a sufficient sample. F1 gives you 24 races per season. That is a decent sample if you are disciplined.
My process for identifying value starts with a baseline model built from three inputs: qualifying pace relative to the field, historical performance at the specific circuit type (street, high-downforce, power-sensitive) and strategy flexibility based on tyre degradation data from practice sessions. I assign each driver a probability estimate for race winner, podium and points finish, then compare those estimates against the bookmaker’s implied probabilities. Where the gap exceeds five percentage points, I flag a potential bet. Where it exceeds ten, I act with higher confidence.
The circuits where value appears most consistently are the ones that produce unpredictable results. Street tracks like Monaco, Jeddah and Singapore generate more safety car periods, more incidents and more strategy disruption. Bookmakers respond by widening their overrounds — but they cannot perfectly price chaos. A driver who is particularly strong in dirty air or who historically gains positions on lap one at a specific street circuit may be underpriced precisely because the bookmaker’s model treats chaos as random rather than patterned. For a deeper dive into the mechanics of finding and exploiting these pricing gaps, my guide to value betting in F1 walks through the full expected value calculation process with worked examples.
One trap to avoid: confusing a long price with a value price. A driver at 100/1 is not automatically good value just because the potential payout is large. If their true probability is 0.5% and the implied probability at 100/1 is 1%, the bet actually carries negative expected value despite the enormous headline return. Value is a relationship between two numbers — your estimate and the market’s — not an absolute price point. I have found more consistent value in the 6.00-15.00 range (roughly 5/1 to 14/1 in fractional) than at extreme outsider prices, because this is the zone where a single qualifying session or weather change can meaningfully shift probabilities without the market fully catching up.

58% of people who bet on motorsport are aged 18-34 — a demographic that tends toward data-literate, digitally native analysis. If you are in that group, you already have the analytical instincts to assess value. The skill is applying them specifically to F1 markets rather than defaulting to the same habits you use for football or tennis. Motorsport rewards patience, pre-race preparation and the willingness to let a weekend’s data unfold before committing your stake. That patience is itself a value-generating discipline.
Odds FAQ
What is the difference between fractional and decimal odds in F1 betting?
Fractional odds show your profit relative to your stake as a ratio — 5/1 means five pounds profit for every pound staked. Decimal odds show your total return per pound staked as a single number — 6.00 means six pounds back including your original stake. Both represent the same underlying price, just expressed differently. To convert fractional to decimal, divide the first number by the second and add one. Most UK bookmakers let you toggle between formats in your account settings.
How do I calculate the implied probability of F1 odds?
For decimal odds, divide one by the decimal price and multiply by 100. A driver at 4.00 has an implied probability of 25%. For fractional odds, divide the right number by the sum of both numbers and multiply by 100. At 3/1, that gives 1 divided by 4, which equals 25%. This tells you the percentage chance the bookmaker’s price assigns to that outcome, before their margin is factored in.
Why do F1 odds change after qualifying?
Qualifying reveals the actual pace hierarchy for that specific weekend, which often differs from pre-weekend expectations. A driver who qualifies on pole from a midfield prediction will see their race winner odds shorten dramatically, while a favourite who struggles in Q2 drifts to longer prices. The shift reflects new information about car setup, track-specific performance and grid position advantage, all of which directly affect race outcome probabilities.
What does overround mean in F1 betting markets?
The overround is the total margin bookmakers build into a market. If you convert every driver’s odds in a race winner market to implied probabilities and sum them, you get a number above 100% — typically 115-130% for F1. That surplus above 100% is the overround and represents the bookmaker’s built-in edge. A lower overround means better value for punters. You can compare overrounds across bookmakers to find the most competitive pricing for a specific race.
Published by the f1 Betting team.