F1 Safety Car Betting: Deployment Odds, Track Patterns and Settling Rules
 Available in US
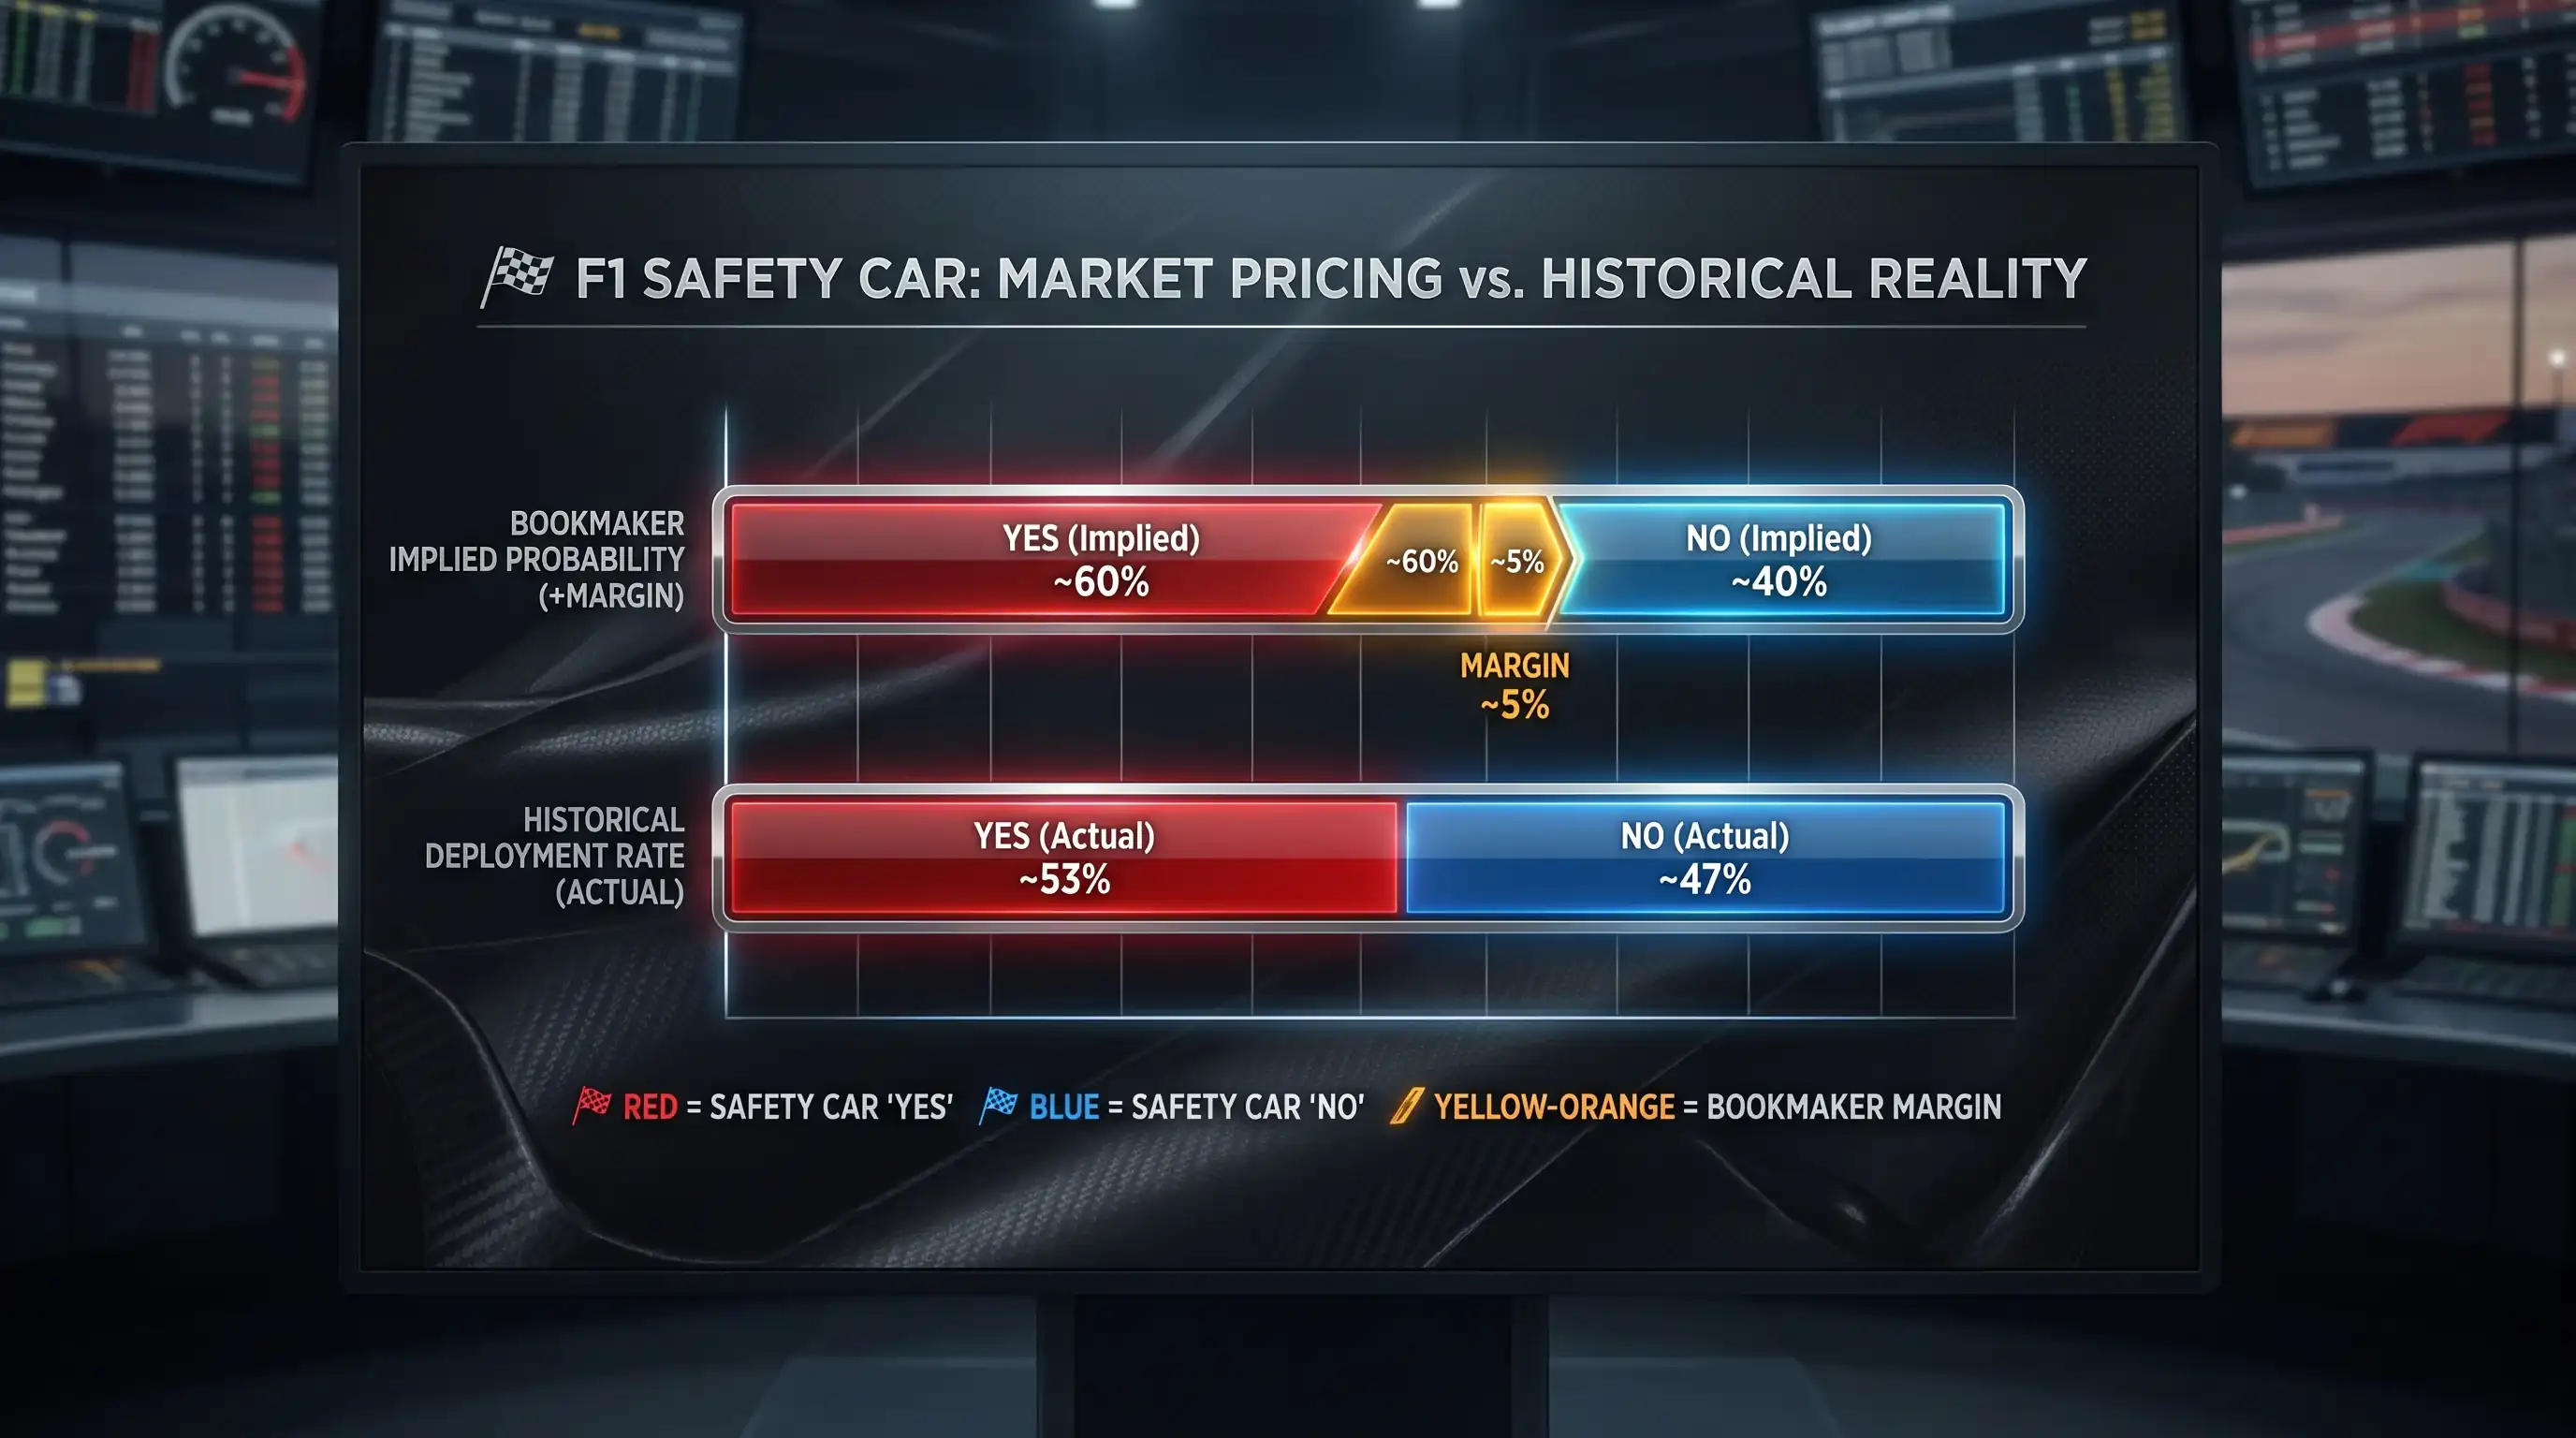
Jeddah, 2022. Three safety cars, two red flags, and a virtual safety car – all in a single race. I’d placed a “yes” bet on safety car deployment at 4/7, which felt like free money at a street circuit. It paid out within seven laps. The real lesson wasn’t that the bet won – it was that the 4/7 implied a 63% probability of deployment, while the historical rate at street circuits sits closer to 85%. That gap between market pricing and historical reality is where safety car betting lives.
Safety car betting covers markets related to whether a physical safety car (SC) or virtual safety car (VSC) will be deployed during a race, how many deployments there will be, and sometimes on which lap the first deployment occurs. It’s one of the most data-friendly markets in F1 because deployment rates are strongly correlated with circuit characteristics – narrow tracks, tight chicanes, and limited run-off areas produce more incidents than wide-open power circuits with generous gravel traps.
Safety Car Yes/No, Over/Under and Lap-of-Deployment Markets
The simplest safety car bet is a binary yes/no market: will a safety car be deployed during the race? Across the past four seasons, the overall deployment rate for at least one safety car or VSC sits around 65-70% of races. That baseline should be your starting point for evaluating the odds. If a bookmaker prices “yes” at implied probability below 65%, you’re looking at potential value before you even consider circuit-specific factors.
Over/under markets add a layer of specificity. The standard line is 1.5 safety car deployments – under means zero or one deployment, over means two or more. Each car on the grid generates approximately 700 data points per second during a race, and while that telemetry is primarily about car performance, it also captures the racing incidents that trigger safety car periods. Circuits with narrow track widths, limited run-off areas, and first-lap bottleneck corners consistently produce higher deployment numbers.

Lap-of-deployment markets – betting on which lap range the first safety car will appear – are less commonly offered but available at some UK operators. These are priced off the statistical distribution of first-deployment timing, which clusters around two peaks: the opening lap (first-corner incidents) and laps 15-25 (the pit window, when strategic risk-taking increases). I find value in the “lap 1-5” ranges at circuits with tight first corners and long runs to the first braking zone, where the pack is bunched and the probability of contact is highest.

Which Circuits Have the Highest Safety Car Rates
I keep a running database of safety car deployments by circuit, updated after every race. The patterns are remarkably stable across seasons, which makes this one of the most predictable aspects of F1 betting. The 2025 season’s record 6.7 million total attendance across 24 races has brought new circuits into the calendar and changed the competitive landscape, but the physical characteristics that determine safety car probability are baked into the track design.
Street circuits dominate the high end of the deployment spectrum. Monaco, Jeddah, Singapore, Baku, and Las Vegas all have narrow racing lines, unforgiving barriers, and limited run-off areas. The historical safety car deployment rate at these venues exceeds 80% – meaning that in eight out of ten races, at least one safety car period occurs. Jeddah and Baku are particularly prolific, with average deployments above two per race over their F1 history.
At the other end, purpose-built circuits with wide run-off areas and few tight chicanes show deployment rates in the 40-55% range. Circuits like Paul Ricard (when it was on the calendar), COTA’s wider sections, and Barcelona’s flowing layout allow drivers to make mistakes and recover without triggering a safety car. The market typically prices these circuits more accurately because the historical data is extensive and the bookmaker’s models are well-calibrated for established venues.

New circuits or those returning to the calendar after a long absence present the best safety car betting opportunities. The bookmaker has limited historical data for these venues, so their pricing relies more on general circuit-type assumptions. I compare the physical characteristics of a new circuit – track width, run-off areas, barrier proximity, corner sequences – against similar established circuits in my database and assess whether the bookmaker’s implied deployment probability is reasonable. When a new street circuit enters the calendar with deployment odds implying 55%, and every comparable street circuit in my data shows 80%+, the value is clear.
Virtual Safety Car vs Full Safety Car: How Each Settles
This is the settlement detail that catches punters out more than any other in F1 betting. A virtual safety car and a full safety car are different things in the sporting regulations, and bookmakers treat them differently – but not all bookmakers treat them the same way.
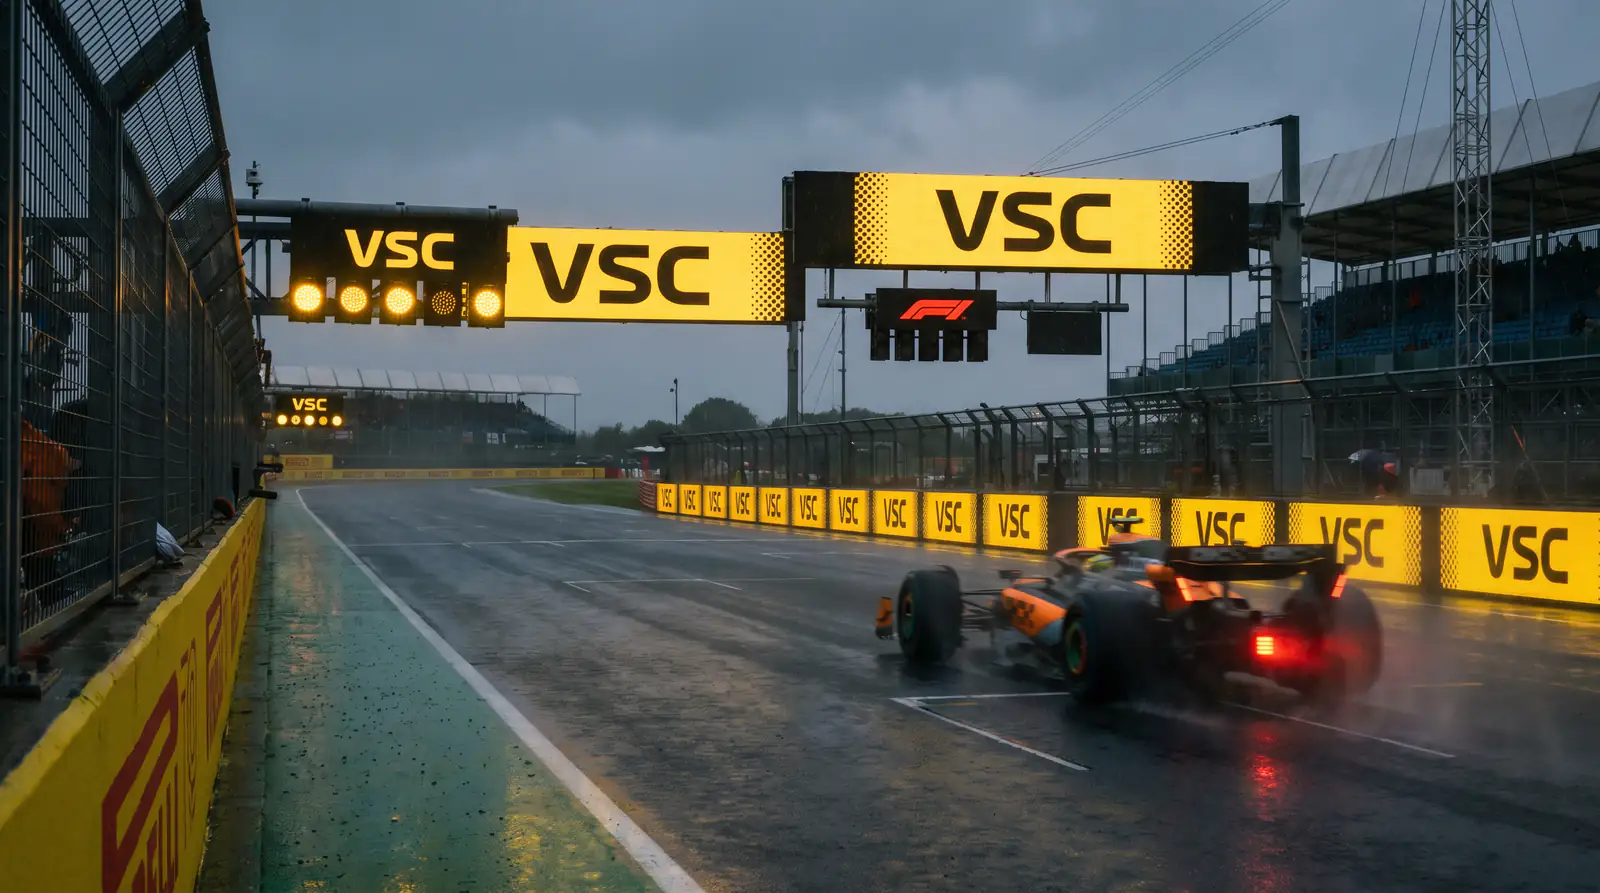
A full safety car deployment brings the physical Mercedes-AMG safety car onto the circuit to lead the field at reduced speed while marshals clear a hazard. A virtual safety car imposes speed limits through the marshalling system without a physical car on track – drivers must maintain a minimum sector time but continue racing in formation. The distinction matters because a VSC causes much less disruption to the race order, while a full safety car bunches the field and can radically change the strategic picture.
For betting purposes, some bookmakers count VSC deployments as safety car deployments. Others do not – their safety car yes/no market specifically covers only full safety car periods, and a VSC doesn’t trigger the “yes” payout. I’ve been caught out by this divergence, and it cost me a bet at the 2023 Italian Grand Prix where a VSC was deployed but my bookmaker’s rules excluded it from the safety car market. Now I verify the settlement terms every single time, even at bookmakers I use regularly, because operators occasionally update their rules between seasons.
My recommendation is to treat VSC and full SC as separate betting propositions. The live betting environment during a race is where safety car deployment has the most dramatic impact on odds across all markets – understanding whether your bookmaker counts VSC as a safety car for settlement is the minimum due diligence before placing. When in doubt, contact support before the race. A two-minute chat message is worth more than discovering after the chequered flag that your bet settled differently than you expected.
Does a virtual safety car count as a safety car in F1 betting markets?
This varies by bookmaker. Some operators include VSC deployments in their safety car yes/no market, while others count only full safety car periods. The distinction is stated in the market rules or settlement terms. Always check your bookmaker’s specific rules before placing a safety car bet.
How do bookmakers settle safety car over/under bets?
Over/under safety car bets are settled on the total number of safety car deployments during the race. Whether VSC counts toward the total depends on the bookmaker. The standard line is 1.5 deployments, meaning ‘over’ requires two or more. Deployments that begin in the final lap typically count if the safety car is officially deployed before the race ends.
Which F1 circuits have the most safety car deployments historically?
Street circuits consistently produce the highest safety car rates. Jeddah, Baku, Monaco, Singapore, and Las Vegas all have historical deployment rates exceeding 80%. Purpose-built circuits with wide run-off areas, such as Barcelona and COTA, tend to have lower rates in the 40-55% range.
Prepared by the f1 Betting editorial staff.