F1 Betting Odds Explained: Fractional, Decimal, and Implied Probability
 Available in US
A friend messaged me during the 2024 Saudi Arabian Grand Prix asking what “7/2” meant on a driver’s race winner odds. He’d been watching F1 for three years and betting casually for one, and he’d never properly understood what the numbers meant beyond “bigger number equals less likely.” That conversation convinced me that odds literacy is the single most underrated skill in F1 betting. You can have the best race analysis in the world, but if you can’t translate odds into probabilities and compare them against your own assessment, you’re guessing dressed up as gambling.
Odds represent the bookmaker’s assessment of the probability of an outcome, plus their margin. Every set of odds encodes two pieces of information: how likely the bookmaker thinks the event is, and how much profit the bookmaker has built into the price. Decoding both gives you the tools to identify when a price represents genuine value – and when it’s a trap.
Fractional Odds and What They Actually Tell You
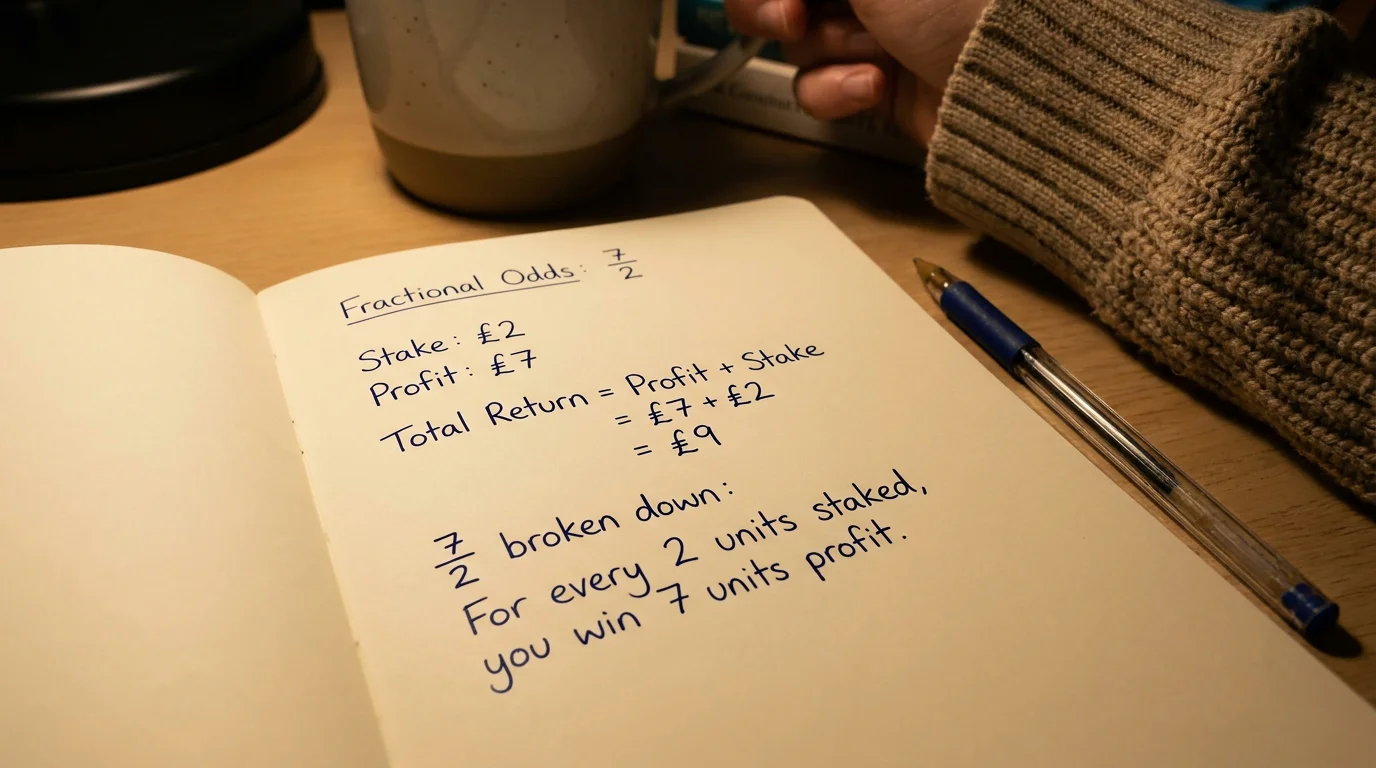
Fractional odds are the traditional UK format and the one most F1 bettors in Britain encounter first. A price of 7/2 means that for every two pounds you stake, you win seven pounds in profit if the bet lands. Your total return is the profit plus your stake: nine pounds back from a two-pound bet. The fraction divides the potential profit (numerator) by the stake required (denominator).
The mental shortcut I use: divide the first number by the second, then add one to get the total return multiplier. So 7/2 is 3.5 plus 1 equals 4.5 – every pound staked returns four pounds fifty if the bet wins. For 5/1, it’s 5 plus 1 equals 6 – six pounds return per pound staked. For 1/3 (odds-on), it’s 0.33 plus 1 equals 1.33 – you risk three pounds to win one pound profit. Odds-on prices in F1 appear on dominant drivers in certain seasons, and they almost never represent value for outright race winner bets.
The peculiar fractions in UK betting – 11/8, 13/8, 100/30 – exist for historical reasons and are gradually being replaced by cleaner formats. But they still appear on F1 markets at traditional UK bookmakers, so knowing that 11/8 means “just under evens” (1.375 multiplied by your stake in profit) and 100/30 is equivalent to 10/3 (a 3.33 multiplier) prevents confusion when comparing prices.
Decimal Odds and Cross-Market Comparison
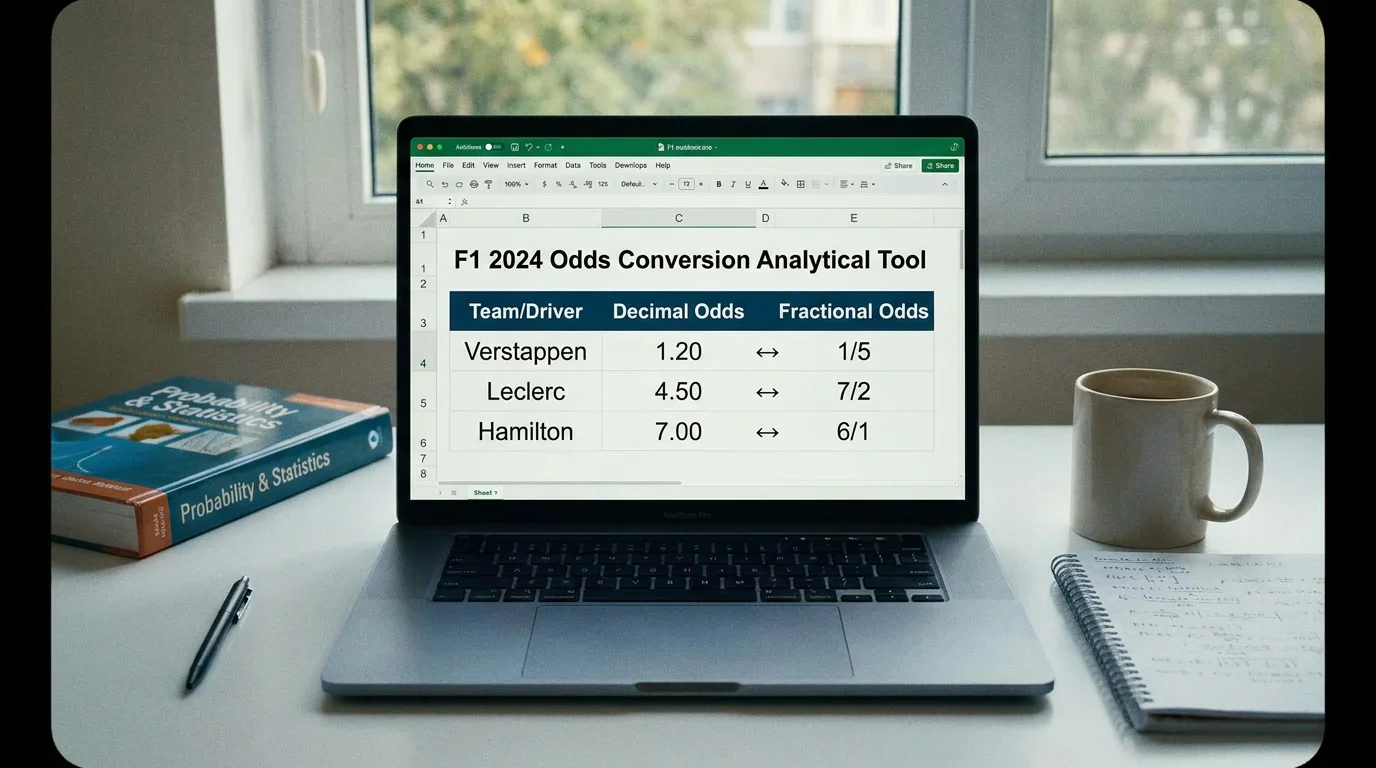
Decimal odds state the total return per unit staked, including the stake itself. An F1 driver at 4.50 in decimal format returns four pounds fifty for every pound bet – identical to 7/2 fractional. The conversion is simple: decimal odds equal (fractional numerator divided by denominator) plus 1. The main advantage of decimal odds is comparison speed. When scanning five bookmakers for the best price on a driver, decimal odds let you spot the highest number instantly without mental arithmetic.
F1 attracts 76.1 million average TV viewers per Grand Prix, and the international audience means many bettors encounter decimal odds first, especially those using European or Asian-facing operators. If you bet across multiple platforms – comparing prices at four or five bookmakers before placing – switching your display to decimal eliminates conversion errors. I use decimal exclusively for my records and analysis, converting to fractional only when discussing bets with friends who prefer the traditional format.
The one trap with decimal odds is that they include your stake in the return figure. A decimal price of 1.50 sounds like a 50% return, but it means risking one pound to profit fifty pence. That same bet in fractional – 1/2 – makes the thin margin more visually obvious. For in-play F1 betting where decisions happen in seconds, the format you’re most fluent in is the format you should use.
Implied Probability: The Number That Actually Matters
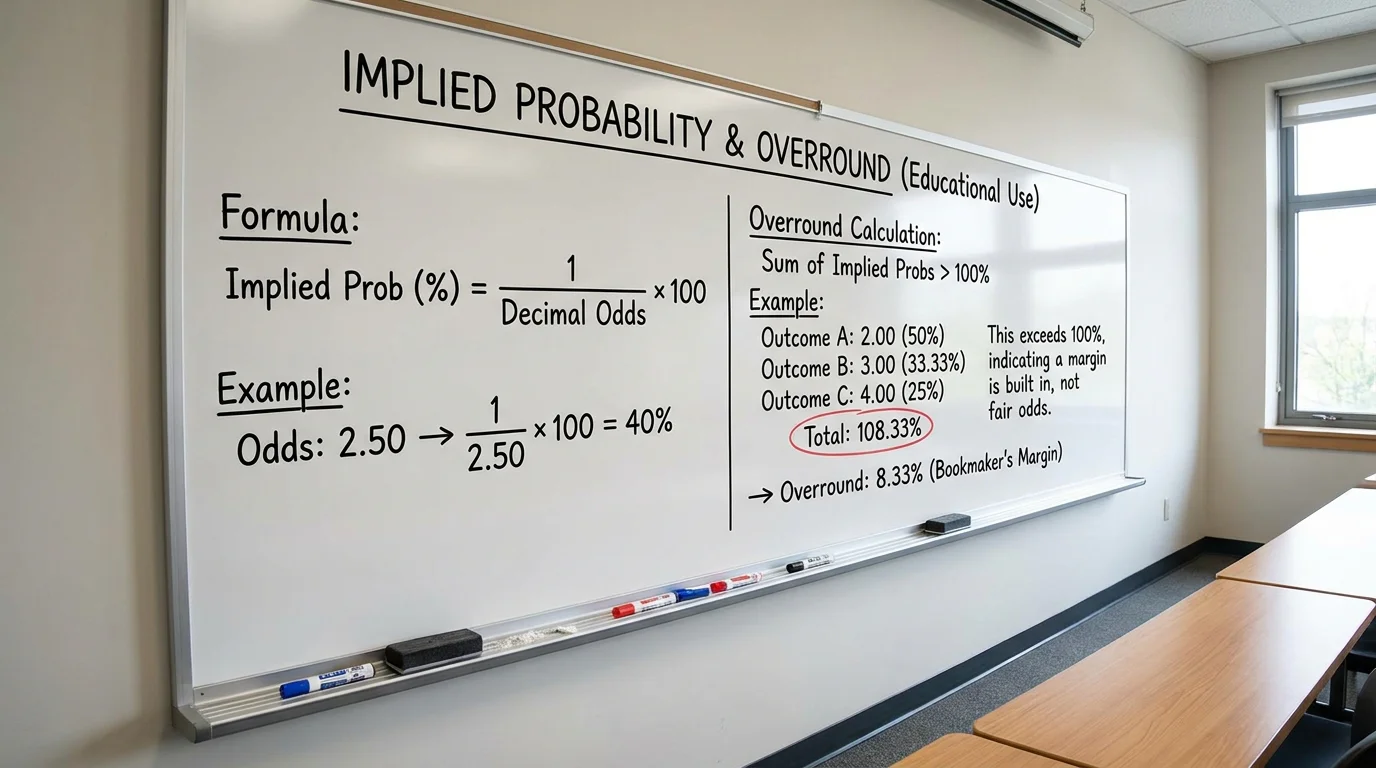
Every set of odds implies a probability. A driver at 4/1 fractional (5.00 decimal) has an implied probability of 20% – the bookmaker estimates a one-in-five chance of winning. The formula for fractional odds: implied probability equals denominator divided by (numerator plus denominator). For 4/1: 1 divided by (4 plus 1) equals 0.20, or 20%. For decimal odds: implied probability equals 1 divided by the decimal odds. For 5.00: 1 divided by 5 equals 0.20.
The reason implied probability matters more than the odds themselves is that it gives you a direct comparison against your own assessment. If you believe a driver has a 30% chance of winning the race and the bookmaker’s odds imply 20%, there’s a ten-percentage-point gap in your favour. That gap is positive expected value – the fundamental requirement for long-term profitable betting. Without converting odds to probabilities, you’re comparing apples to oranges when evaluating whether a price is worth taking.

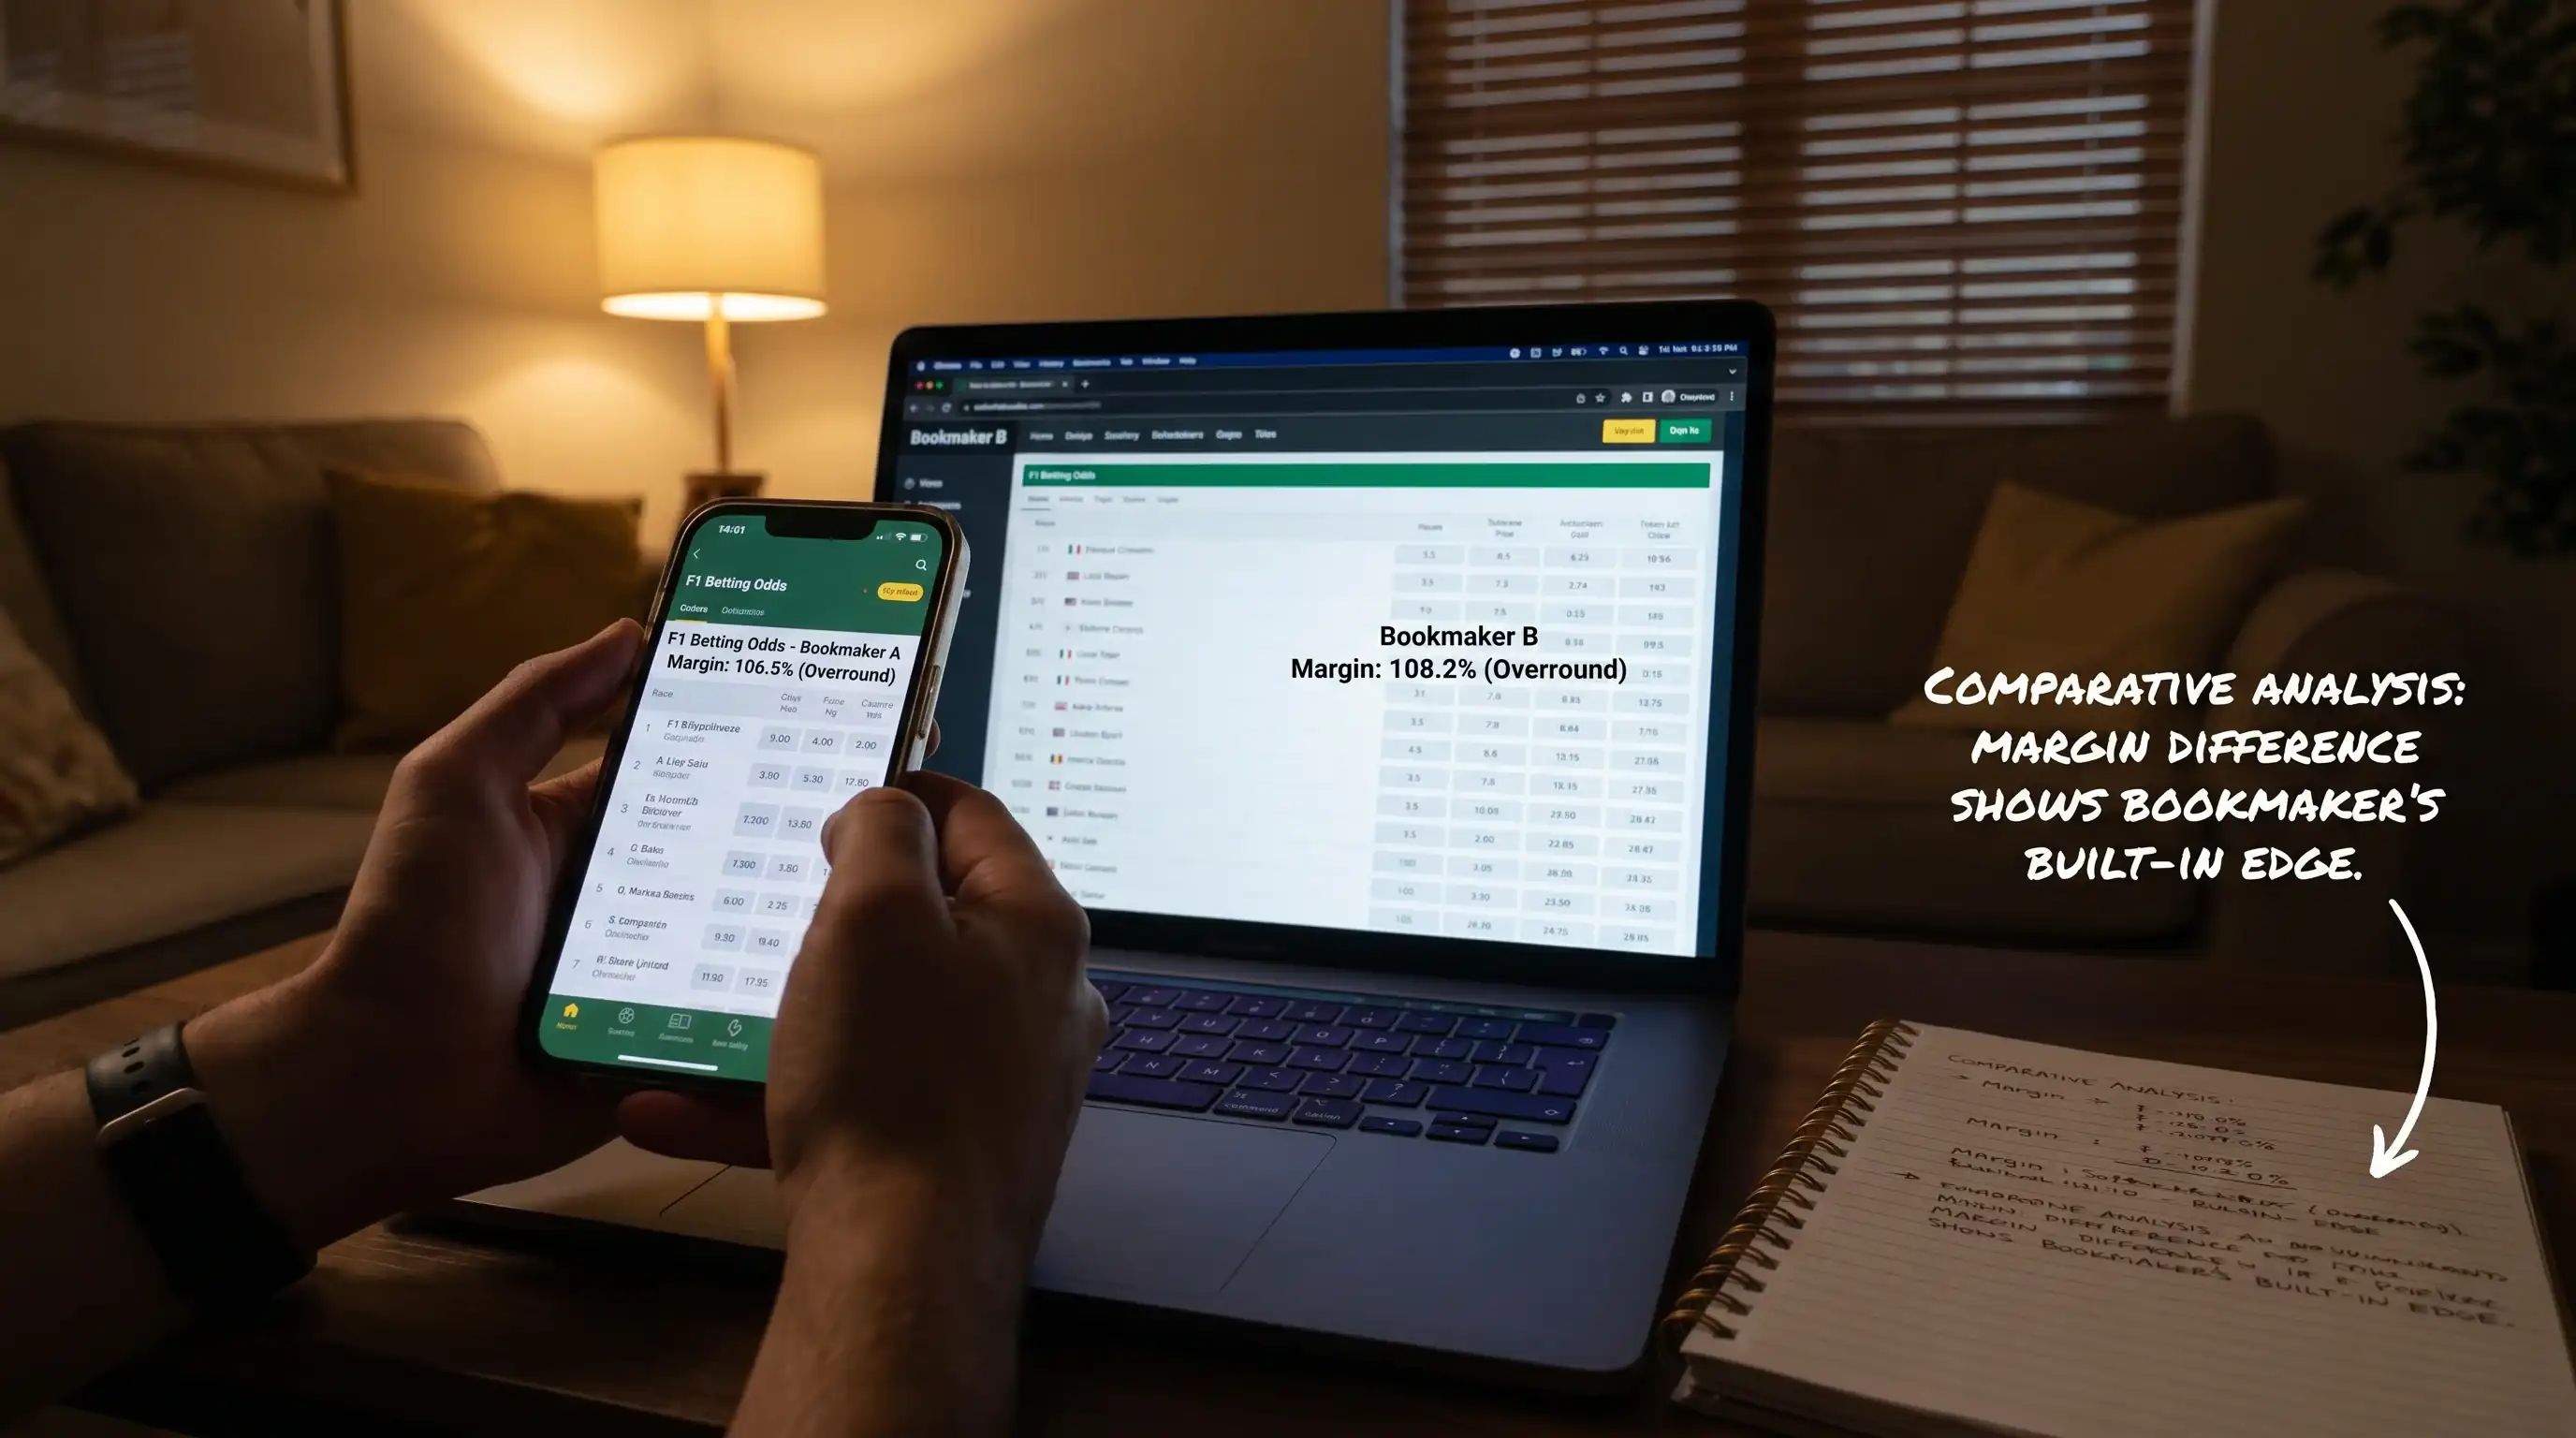
The bookmaker’s margin – also called the overround or vig – inflates the implied probabilities across the entire market. If you sum the implied probabilities for every driver in a race winner market, the total will exceed 100%, typically by 5-15%. That surplus is the bookmaker’s edge. For example, a market with a 110% total book means the bookmaker retains roughly 10% of all money wagered over time. When I assess value, I strip out the margin by dividing each driver’s implied probability by the total book percentage, giving me the bookmaker’s “true” probability estimate. Only then do I compare it to my own.
Using Odds Fluency to Find Mispriced F1 Markets
The practical application of odds literacy is price comparison – the habit of checking the same market at multiple operators before placing. The 10% of UK adults who bet online on sport could improve their returns by doing nothing more than shopping for the best price. The difference between 7/2 and 4/1 on the same driver is the difference between a 4.50 return and a 5.00 return per unit – an 11% improvement in profit for sixty seconds of comparison.
I maintain a race-day spreadsheet with columns for each bookmaker I use, the driver, the fractional odds, the decimal equivalent, and the implied probability. Before every Grand Prix, I populate this for my shortlisted selections and highlight the best available price in each market. Over a season, consistently taking the best price on every bet – rather than defaulting to a single operator – adds roughly 10-15% to the long-run return. That’s the odds comparison discipline in practice: not a theoretical improvement but a measurable one that compounds across twenty-four race weekends.
The discipline extends to recognising when no available price offers value. If my probability assessment for a driver is 25% and every bookmaker’s best odds imply 23% or more, there’s no edge to exploit. Passing on that bet is as important as taking one with a clear advantage. Odds fluency isn’t about betting more – it’s about betting smarter and knowing exactly what each price means in the language of probability.
What is the easiest way to convert fractional F1 odds to implied probability?
Divide the denominator by the sum of numerator and denominator. For 7/2 odds: 2 divided by (7 plus 2) equals 0.222, or 22.2%. This tells you the bookmaker estimates approximately a 22% chance of that outcome, before their margin is factored in.
Why do the implied probabilities in an F1 market add up to more than 100%?
The excess above 100% is the bookmaker’s margin, also called the overround. A typical F1 race winner market totals 105-115%. This margin is how the bookmaker guarantees a profit over time. Lower-margin markets are better for punters because the odds more closely reflect true probabilities.
Written by the editors at f1 Betting.